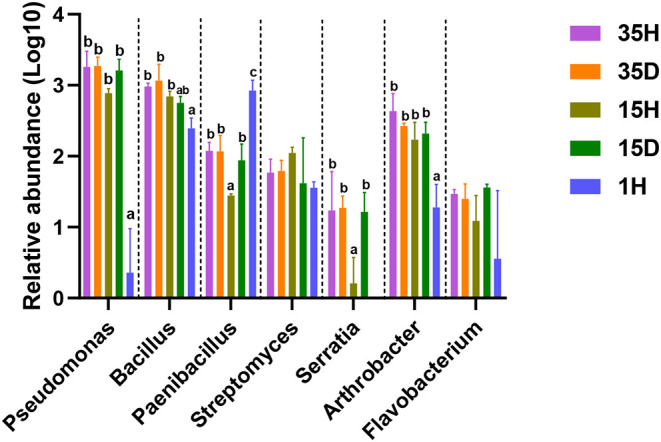
Figure 3.

The relative abundance of plant growth-promoting rhizobacteria (PGPRs). The relative abundance of each PGPRs was multiplied by 100,000, and then the LOG10 value was calculated. Different letters indicate significant differences based on one-way ANOVA (Turkey test) at P < 0.05.
