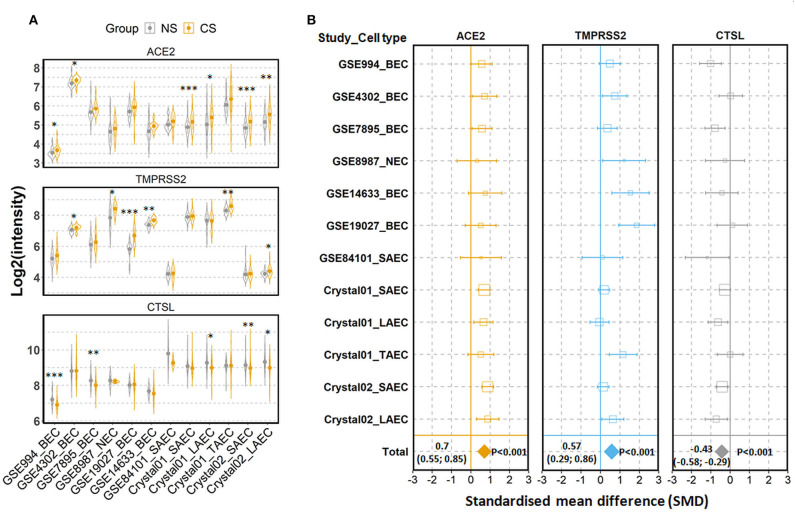
Figure 2.
Expression of ACE2, TMPRSS2, and cathepsin L (CTSL) in airway epithelial cells of healthy current smokers (CS) and never smokers (NS). (A) Violin plot of expression levels of ACE2, TMPRSS2, and CTSL in 12 datasets which contain current smokers and never smoker. Mean and standard deviation (SD) of each group are presented as dot and line, respectively. Statistical difference was calculated by Student's t-test. *p < 0.05, **p < 0.01, ***p < 0.001. (B) Forest plot of 12 datasets examining expression of ACE2, TMPRSS2, and CTSL in current smokers and never smokers. The x-axis indicates the standardized mean difference (SMD), while the y-axis shows GEO datasets and cell types. Each square in the plots represents the SMD in corresponding datasets and the 95% confidence interval (CI) is shown by the error bar. The size of each square represents the weight of the individual dataset in the meta-analysis. The diamonds in the bottom represent the SMD of the meta-analysis. The SMD, 95% CI and P-values of meta-analysis are depicted. BEC, bronchial epithelial cell; NEC, nasal epithelial cell; SAEC, small airway epithelial cell; LAEC, large airway epithelial cell; TAEC, trachea airway epithelial cell.

