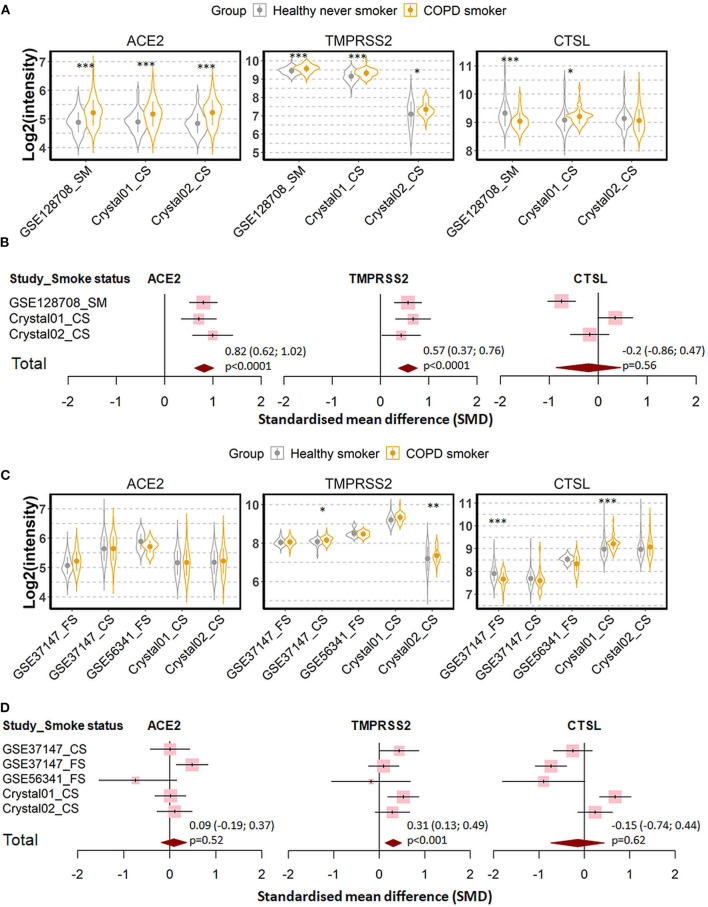
Figure 5.
Expression of ACE2, TMPRSS2, and cathepsin L (CTSL) in airway epithelial cells of healthy subjects and COPD patients. (A) Violin plot of expression levels of ACE2, TMPRSS2, and CTSL in three datasets which contain healthy never smokers and patients with COPD. Statistical difference was calculated by Student's t-test. *p < 0.05, **p < 0.01, ***p < 0.001. (B) Forest plot of three datasets examining expression of ACE2, TMPRSS2, and CTSL in healthy never smokers and patients with COPD. The SMD, 95% CI and P values of meta-analysis are depicted. (C) Violin plot of expression levels of ACE2, TMPRSS2, and CTSL in five datasets which contain healthy smokers and patients with COPD. (D) Forest plot of five datasets examining expression of ACE2, TMPRSS2, and CTSL in healthy smokers and patients with COPD. CS, Current smokers; FS, Former smokers.

