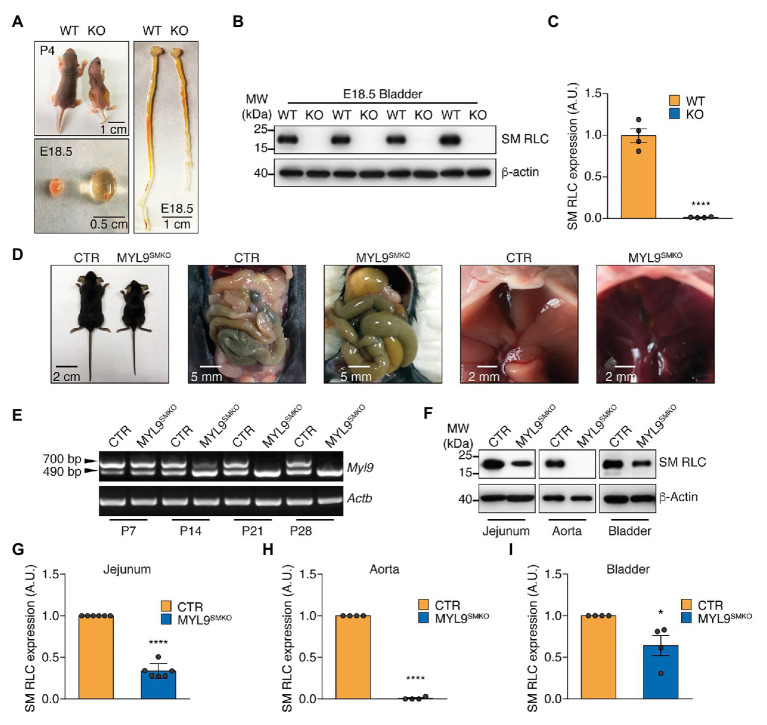
Figure 1.
Characterization of Myl9 knockout mice. (A) Photographs of wildtype (WT) and Myl9−/− (KO) mice at P4, as well as their bladder and gastrointestinal system at E18.5. The scale bars are labeled in the figures. (B) Western blot analysis of smooth muscle myosin regulatory light chain (SM RLC) expression levels in E18.5 KO and WT mouse bladder SM tissues. β-actin was employed as a loading control. (C) Statistical analysis of panel (B). The values are expressed relative to that in WT. The data are presented as mean ± SEM (n = 4). ****p < 0.0001 (unpaired Student’s t-test, one-sided). (D) Photographs of control (CTR) and MYL9SMKO mice at P28, as well as their gastrointestinal systems and livers. (E) Real-Time PCR (RT-PCR) detection of SM RLC mRNA levels in jejunum SM cells from CTR and MYL9SMKO mice at different ages. The 700 bp band represents the wildtype allele, and the 490 bp band represents the knockout allele. (F) Western blot analysis of SM RLC expression levels at day P28 in jejunum, aorta, and bladder SM cells from CTR and MYL9SMKO mice. β-actin was employed as a loading control. (G–I) Statistical analysis of panel (F). The values are expressed relative to their loading control. The data are presented as mean ± SEM (jejunum: n = 6; aorta: n = 4; and bladder: n = 4). *p < 0.05 and ****p < 0.0001 (paired Student’s t-test, one-sided). AU, arbitrary units; MW, molecular weight.

