
Figure 3.
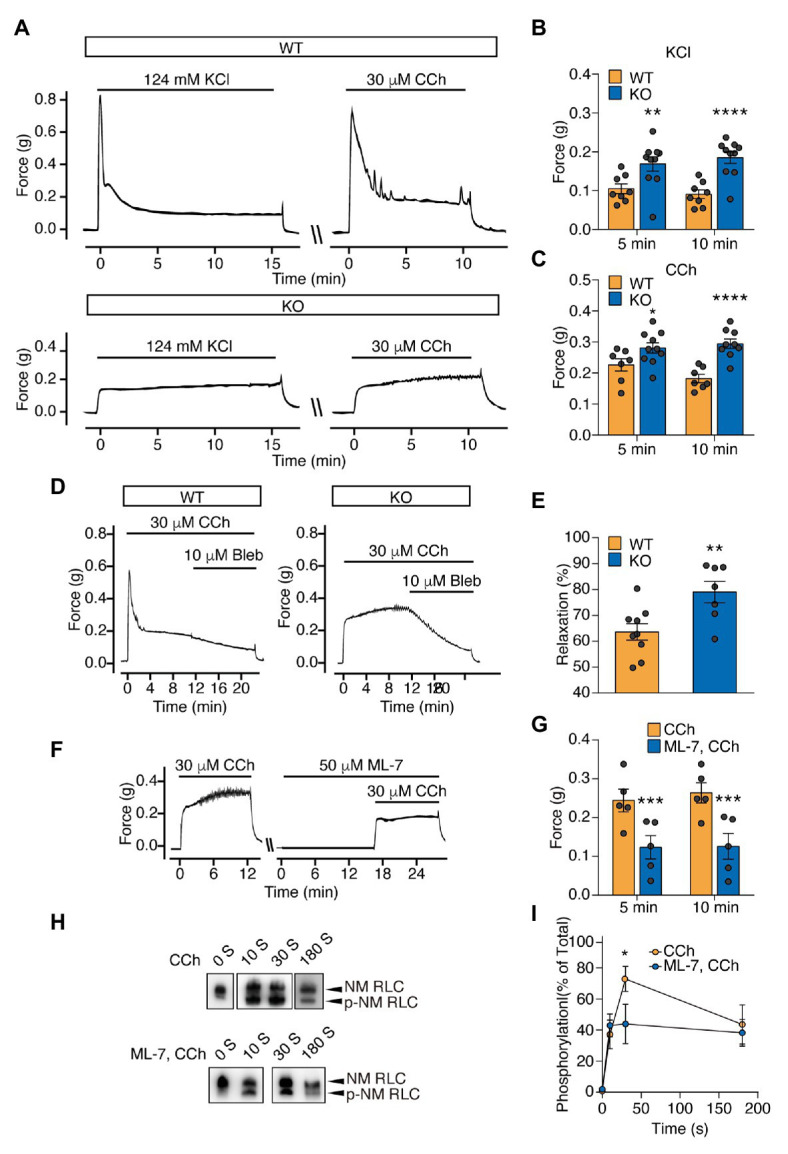
Sustained force is significantly increased in the bladder SM of Myl9 global knockout mice at E18.5 and mediated by non-muscle (NM) RLC phosphorylation by myosin light chain kinase (MLCK). (A) Representative force tracing of bladder SM from E18.5 WT and KO mice. (B) Statistical analysis of the KCl-induced force at 5 and 10 min in panel (A; WT: n = 8; KO: n = 10). (C) Statistical analysis of the CCh-induced force at 5 and 10 min in panel (A; WT: n = 7; KO: n = 10). The data are presented as mean ± SEM. *p < 0.05; **p < 0.01 and ****p < 0.0001 (unpaired Student’s t-test, one-sided). (D) Representative force tracing of CCh-induced bladder SM contraction when the NM myosin inhibitor blebbistatin (Bleb) was applied. (E) Statistical analysis of the percentage of relaxation in Panel (D; WT: n = 9; KO: n = 7), Y value = the force after inhibitor application for 10 min/the force when Bleb was applied. The data are presented as mean ± SEM. **p < 0.01 (unpaired Student’s t-test, one-sided). (F) Representative force tracing of E18.5 KO mice revealed bladder SM contraction before and after MLCK inhibitor (ML-7) treatment for 15 min. (G) Statistical analysis of the CCh induced force at 5 and 10 min, with or without ML-7 pretreatment in panel (F; WT: n = 5; KO: n = 5). The data are presented as the means ± SEM. ***p < 0.001 (paired Student’s t-test, one-sided). (H) Time-course of NM RLC phosphorylation in E18.5 KO bladder SM tissues induced by CCh with or without ML-7 application. The upper band and lower band represent non-phosphorylated and phosphorylated NM RLC, respectively. (I) Statistical analysis of the phosphorylated RLC level in panel (H; CCh: n = 5–7; ML-7, CCh: n = 4–6). The data are presented as mean ± SEM. *p < 0.05 (unpaired Student’s t-test, one-sided).