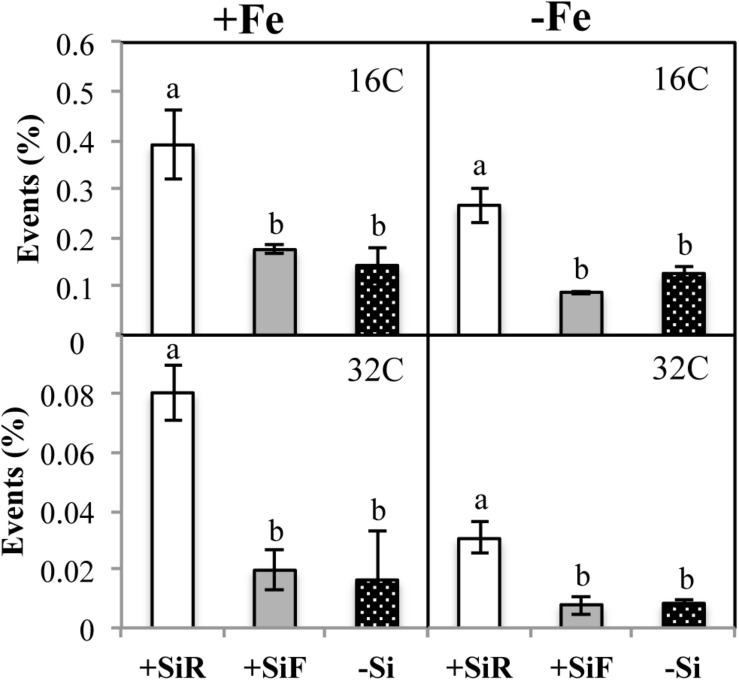
FIGURE 2.
Cellular cycle (% events) in new leaf of cucumber plants under different Fe [21 days of Fe sufficiency (+Fe) and 10 days of sufficiency + 7 days of Fe deficiency (−Fe)] and Si [Si applied to root (+SiR), leaves (+SiF), and no Si (−Si) application] treatments. The data are the mean ± SE (n = 3). Different letters in the same row showed significant differences according to Duncan’s test (p < 0.05).

