Figure 2.

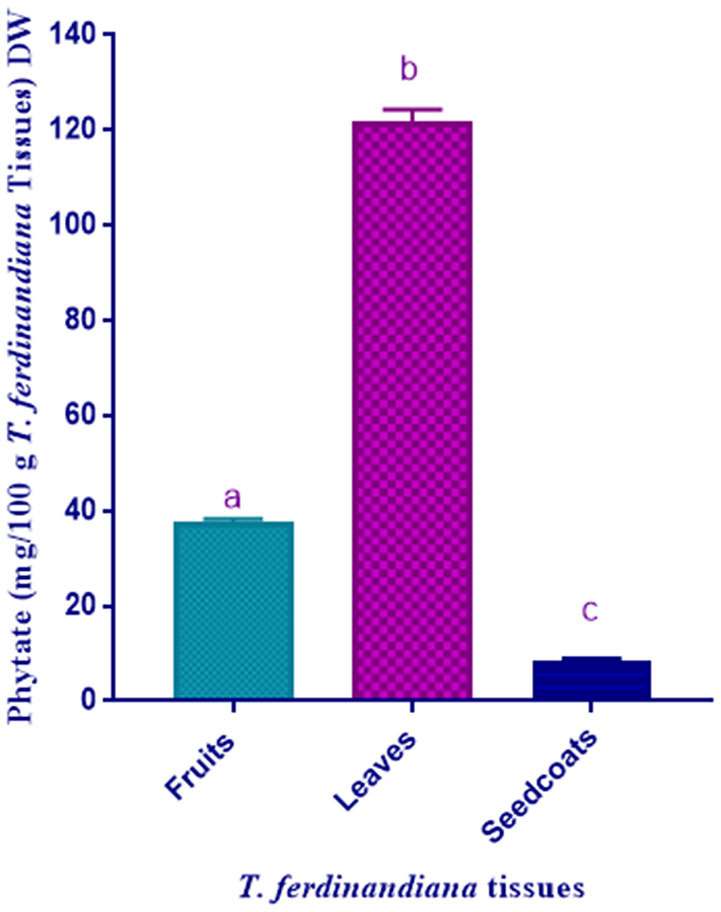
Phytate content of T. ferdinandiana. Results are shown as the mean of triplicate experiments ± SD. Different lower case letters indicate significant differences (P ≤ 0.05).

Phytate content of T. ferdinandiana. Results are shown as the mean of triplicate experiments ± SD. Different lower case letters indicate significant differences (P ≤ 0.05).