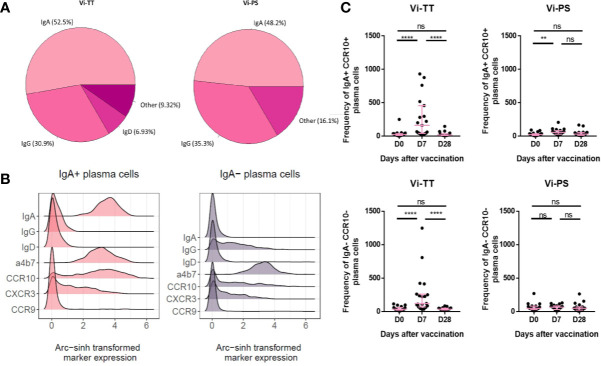
Figure 3.
Vi immunization induces a sub-population of gut-homing B-cells. (A) Surface immunoglobulin expression across plasma cells from either Vi-TT or Vi-PS vaccinees was assessed by manual gating at 7 days post-vaccination. (B) Cells from clusters D and E were grouped according to their expression of IgA. Homing marker expression on IgA+ and IgA- cells is shown using density plots. (C) The frequencies of IgA+ and IgA- plasma cells at baseline, 7, and 28 days after vaccination with either Vi-TT (n = 19) or Vi-PS (n = 20). Each dot represents the number of plasma cells from an individual at a specific time point. Significance was determined by a Wilcoxons signed paired rank test (two-tailed). **p < 0.01, ****p < 0.0001, ns, not significant. Participants in (B) were vaccinated with Vi-TT and participants in (C) were vaccinated with Vi-PS. Mean frequency for each group and 95% confidence intervals are plotted. D0, Day 0, day of vaccination; D7, 7 days after vaccination; D28, 28 days after vaccination; CyTOF, Cytometry Time of Flight; Vi-PS, Vi-polysaccharide vaccine; Vi-TT, Vi-tetanus conjugate vaccine.

