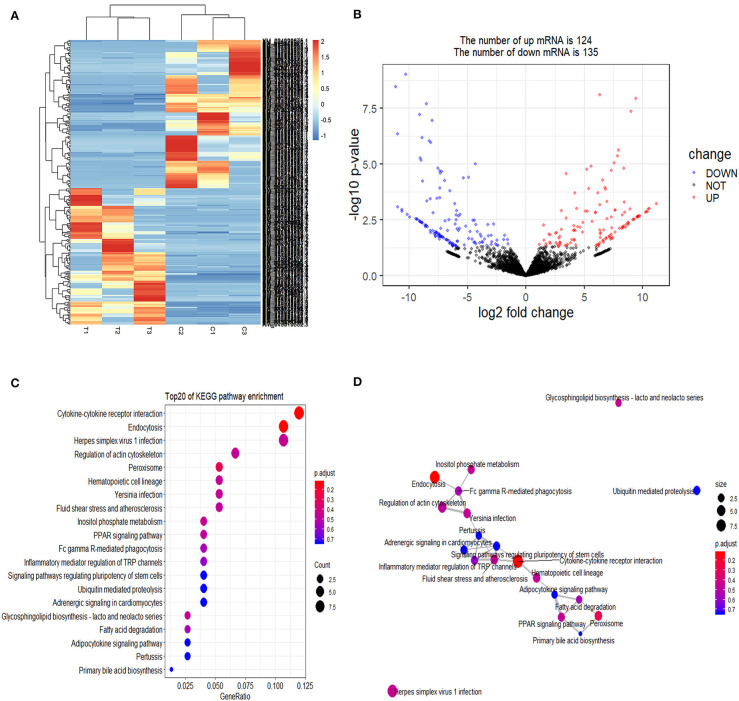
Figure 1.
Screening and enrichment analysis of differently expressed mRNAs (DEmRNAs) in S. aureus infected mammary epithelial cells compared with non-infected mammary epithelial cells. (A) Cluster analysis of DEmRNAs in mammary epithelial cells between the control group (C1, C2, and C3) and treatment group (T1, T2, and T3). Red indicates highly expressed genes, and blue indicates low expressed genes. Each column represents a sample, and each row represents a gene. On the left is the tree diagram of mRNA clustering, and on the right is the name of each mRNA. The closer the two mRNA branches are, the closer their expression level is. The upper part is the tree diagram of sample clustering, and the bottom is the name of each sample. The closer the two-sample branches are to each other, the closer the expression pattern of all genes in the two samples are and the trend of the more recent gene expression. (B) Volcano plot of global DEmRNAs in mammary epithelial cells between the control group and treatment group. Red dots (Up) represent significantly up-regulated genes [P < 0.05, | log2(fold-change) | >1]; blue dots (Down) represent significantly down-regulated genes [P < 0.05, log2(fold-change) < −1]; black dots represent insignificantly differential expressed genes. (C) KEGG pathway classified annotation of DEmRNAs in mammary epithelial cells. The pathway is exhibited in the left axis, and the size of the circle represents the number of genes listed in the right axis. (D) The relationship between these pathways is illustrated.

