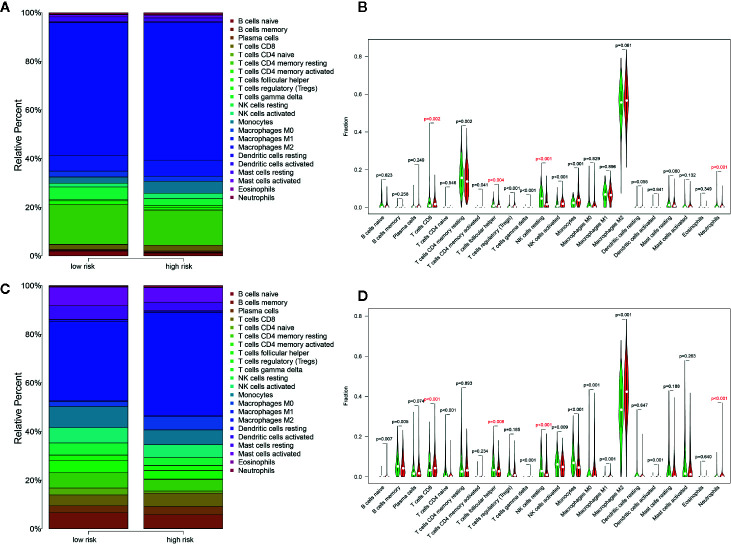
Figure 8.
Distribution of immune cells between risk groups. (A) Proportions of immune cells based on risk groups in TCGA glioma samples. (B) Violin plot of the differentiation of immune cells between risk groups in TCGA glioma samples. (C) Proportions of immune cells based on risk groups in CGGA Glioma samples. (D) Violin plot of the differentiation of immune cells between risk groups in CGGA Glioma samples.

