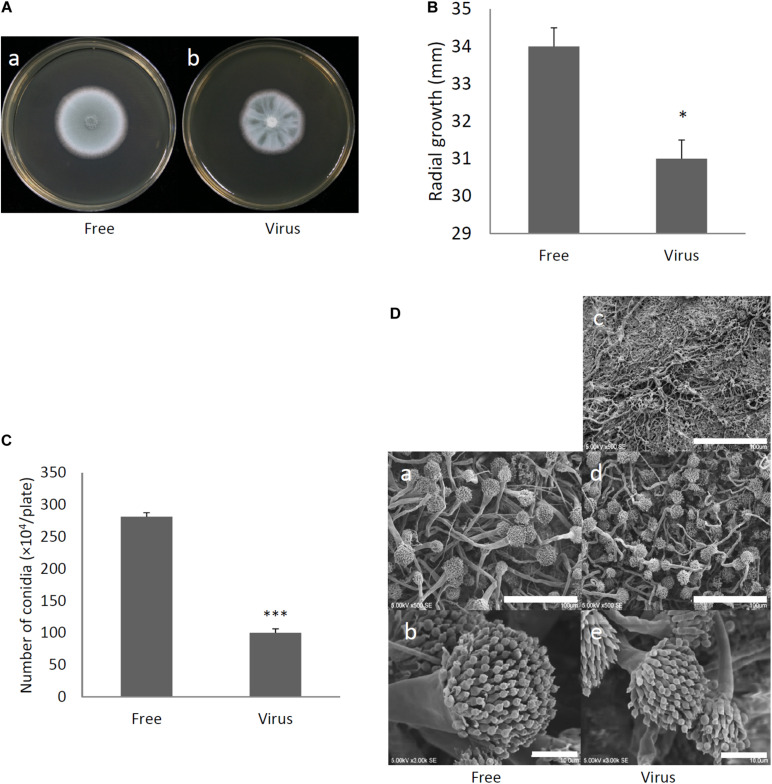
FIGURE 3.
Comparisons of colony morphology and conidial formation of virus-free (Free) and virus-infected (Virus) strains. (A) Colony morphology of AfuPmV-1M virus-free (a) and virus-infected (b) A. fumigatus strains (cultured for 2 days). (B) Radial growth of colonies formed by virus-free and AfuPmV-1M virus-infected A. fumigatus strains. Statistically significance was determined using a two-tailed Student’s t-test, ∗p < 0.05. (C) Numbers of conidia formed by the strains at 24 h post-inoculation. Statistically significance, ∗∗∗p < 0.001. (D) Conidiophore formation in virus-free and virus-infected A. fumigatus strains. SEM images. (a,b) Virus-free. (c–e) Virus infected strain. (a,d) Green areas of the colonies. (c) White area of the colony. (b,e) Conidiophores. The scale bars indicate 100 μm for (a,c,d) and 10 μm for (b,e).

