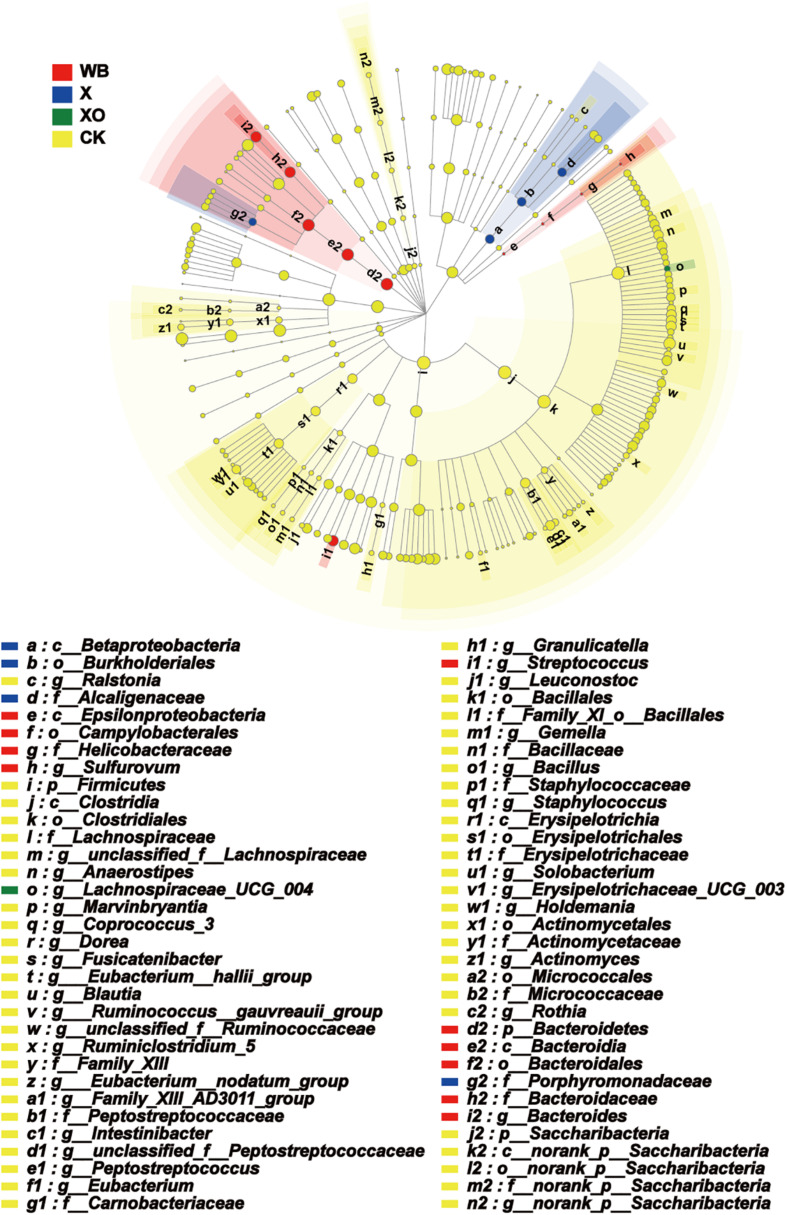
FIGURE 7.
Phylogenetic distribution of the microbiota lineages in the four groups. WB, wheat bran; X, xylan; XO, xylooligosaccharides. The different color nodes represent microbiota communities that are significantly enriched in the corresponding groups and significantly influence the differences between the groups; the pale yellow nodes indicate that the microbial groups either have no significant effect on the different groups or have no significant effect on the differences between groups.

