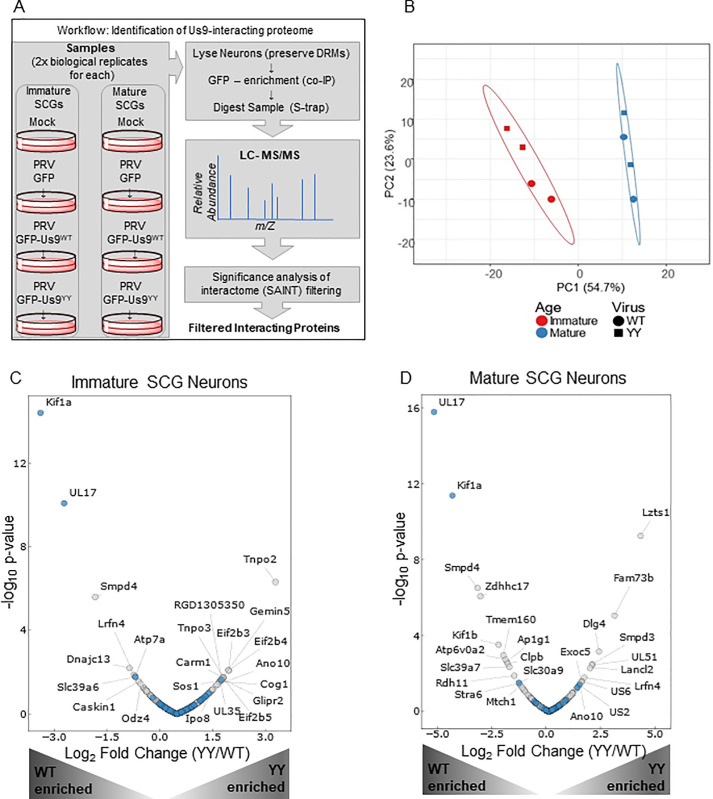
Fig 4. Identification of Us9 neuronal protein interaction networks.
A: Workflow describing the experimental setup. The 8 samples include immature and mature SCG neurons that are mock/uninfected or infected for 12 h with PRV 151 (GFP control), PRV 341 (GFP-Us9WT) or PRV 442 (GFP-Us9YY). Samples were lysed in detergent-resistant-membrane (DRM) preserving lysis buffer, followed by co-IP with GFP-conjugated magnetic beads and LC-MS/MS analysis. The resulting dataset was specificity filtered using the SAINT algorithm to identify high confidence interacting proteins. B: Principal Component Analysis (PCA) of the specificity-filtered data revealed clustering driven by neuronal developmental age rather than the virus state of infection. The immature neurons (red) clustered together, and the mature neurons (blue) clustered together. C and D: Volcano-Plot representation of the immature (C) and mature (D) neuronal interactome that is associated with Us9WT (left-half of each plot) or Us9YY (right-half of each plot). Grey dots represent novel interactions and blue dots represent proteins previously reported to interact with Us9. Proteins labeled with gene names are significantly (p-value ≤0.05) differential in relative association between US9WT and US9YY.

