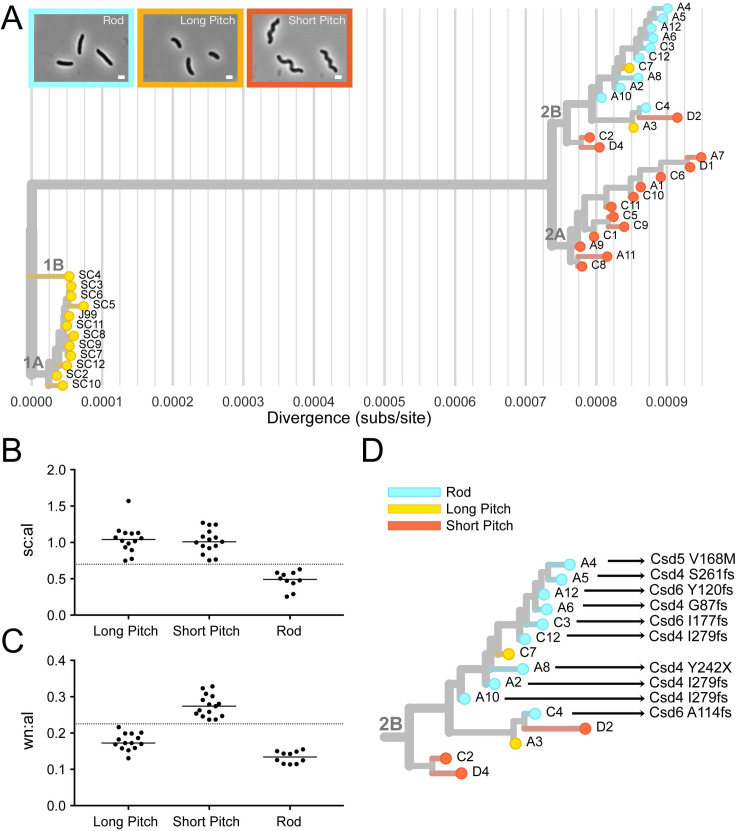
Fig 7. Cell morphology varies among genetically distinct subgroups.
(A) Cell shape phenotype clustering on maximum likelihood tree. Leaves colored to indicate cell morphology phenotype of each isolate with rods in blue, short pitched in red, and long pitched in yellow. Representative phase contrast micrographs of each morphologic class shown. (magnification = 100x, scale bar = 1 μm). (B-C) Cell shape parameters calculated from 2-D phase images with CellTool software for isolates with indicated cell morphologies. Individual points represent mean values for measurements taken from >100 cells/isolate. Side curvature and wavenumber values were normalized by cell centerline axis length. (B) Mean side curvature values normalized by centerline axis length (sc:al) is decreased in rod shaped cells (<0.7, as indicated by y-axis line) and (C) wavenumber normalized by centerline axis length (wn:al) is increased for cells that have increased wavenumber (>0.225, as indicated by y-axis line). (D) Subgroup 2B labeled with amino acid mutations in cell shape determining proteins (Csd4, Csd5, Csd6).

