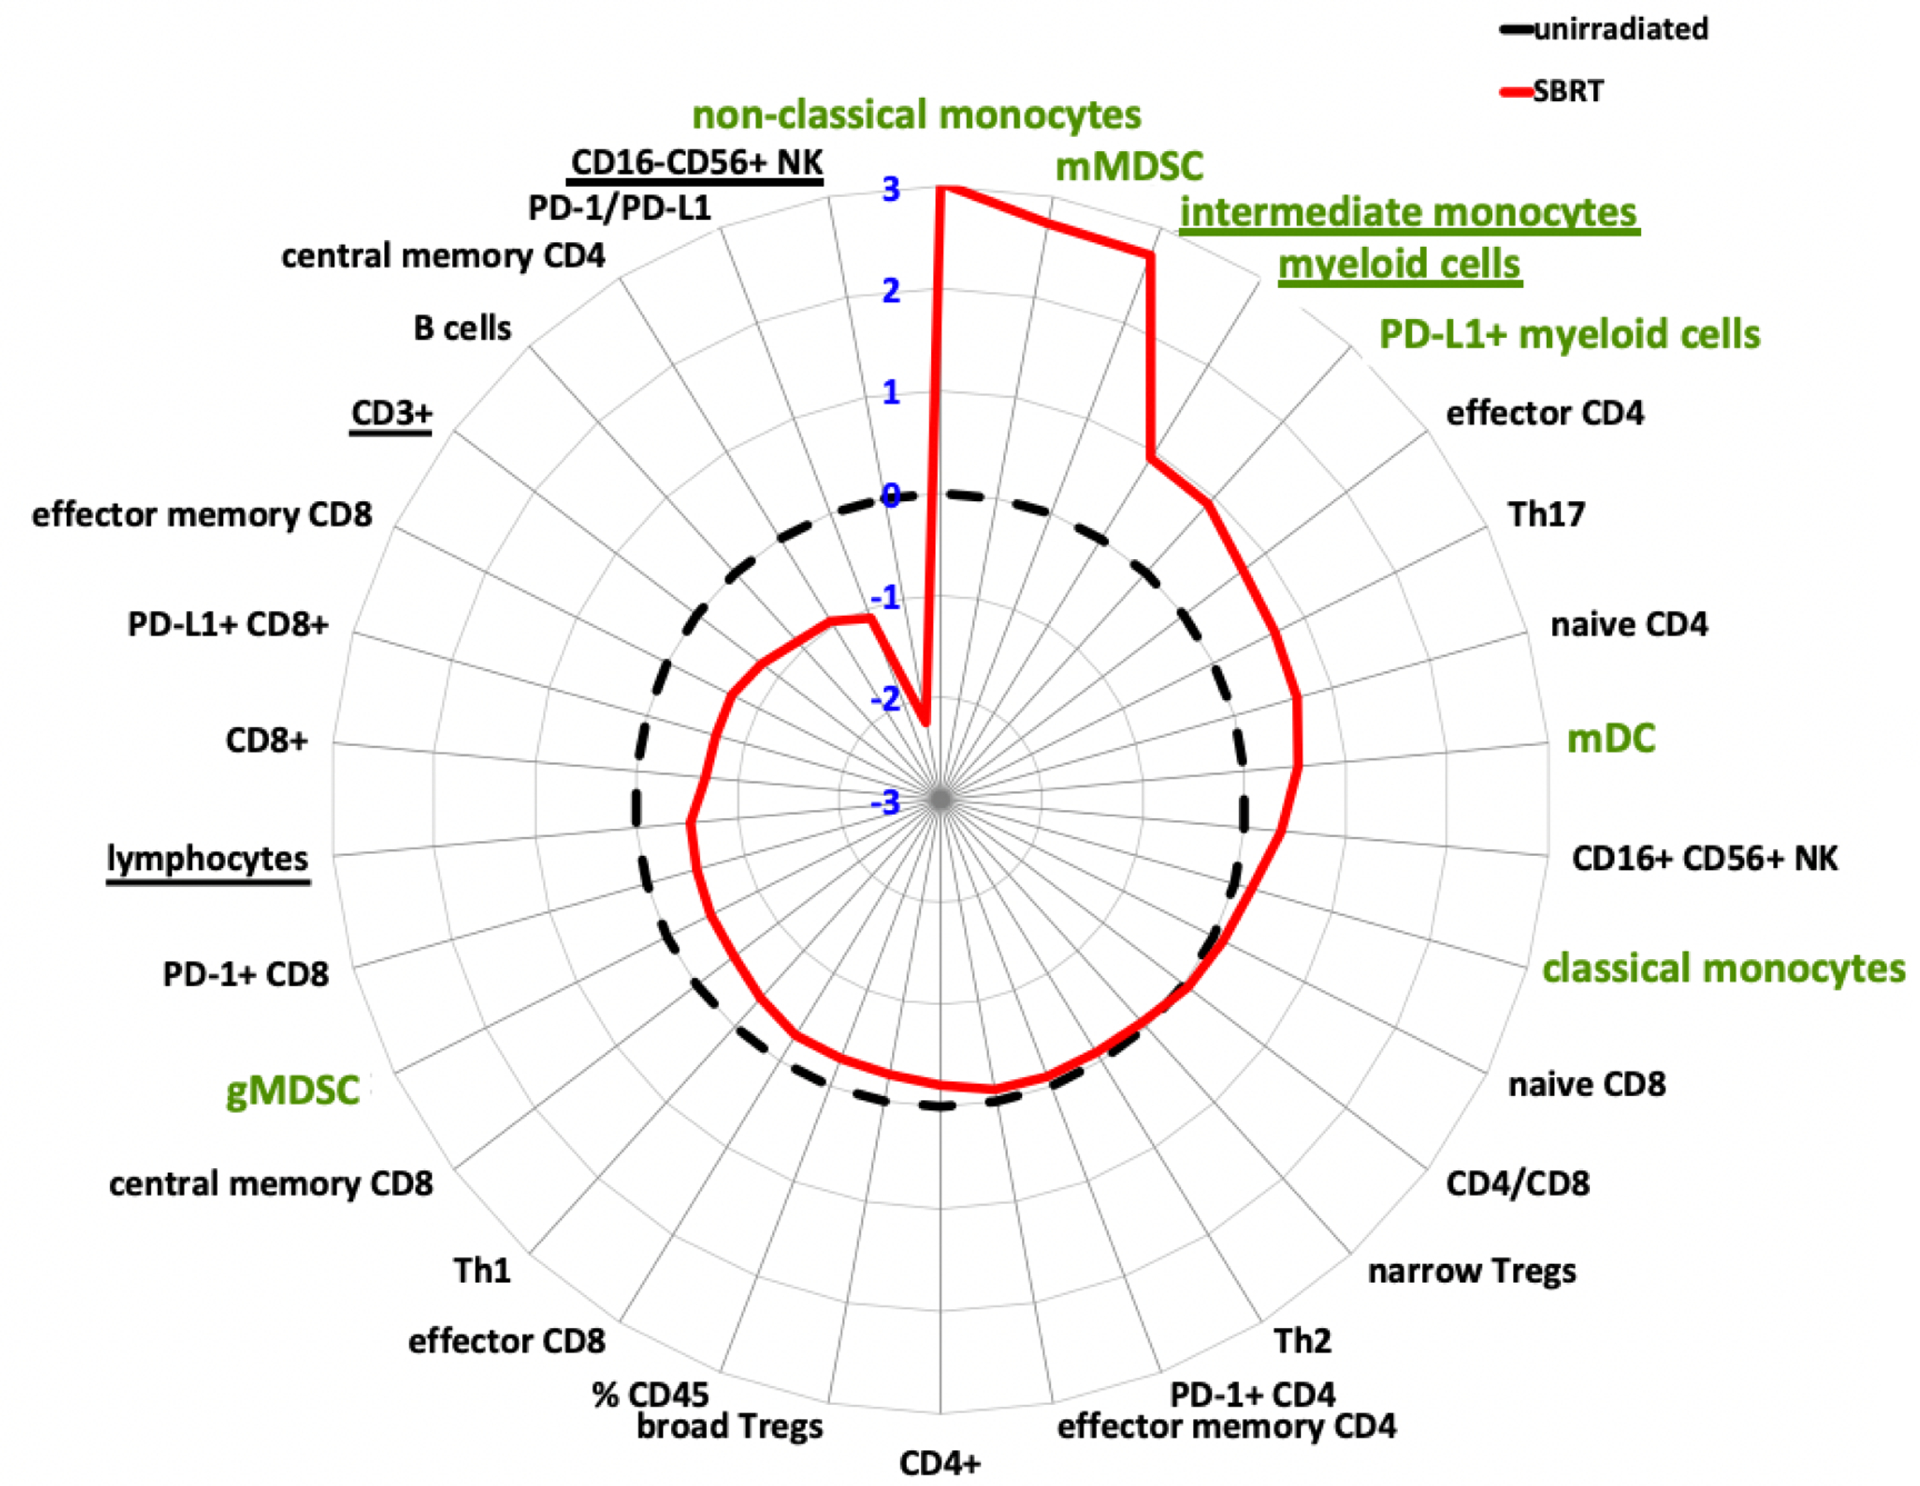
Figure 1. Prostate SBRT drives a lymphoid-to-myeloid shift in the balance of infiltrating immune cells.

Polar graph illustrating the mean log2-fold differences in prostate tumor infiltrates following pre-operative, hypofractionated SBRT (n=9, solid red line) compared to unirradiated prostate tumors (n=7, black, dotted line). All immune subpopulations were gated on CD45+. Data are log2[mean value irradiated/mean value unirradiated]. Myeloid subsets highlighted in green. Underlined subsets indicate significant differences between irradiated vs non-irradiated based on adjusted p value = 0.2 (false discovery rate threshold).
