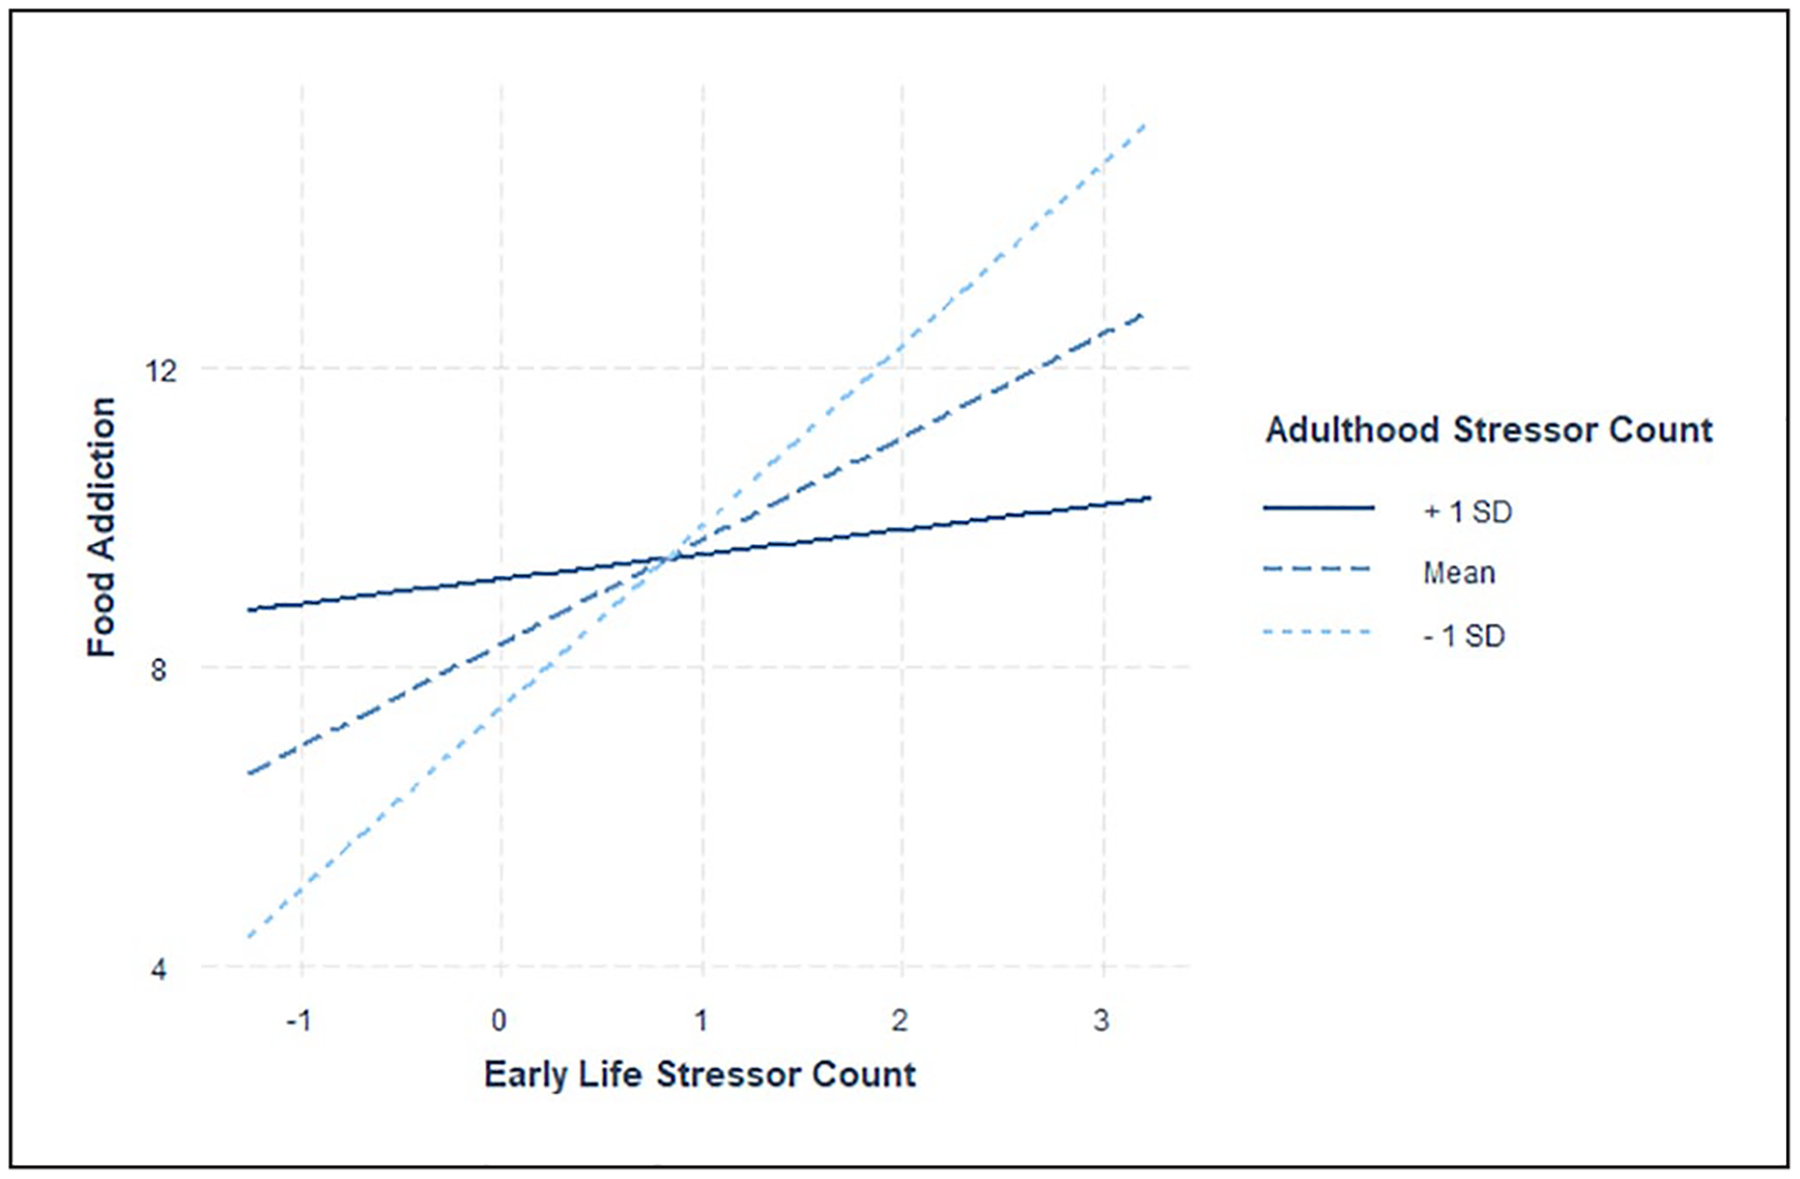
Figure 3.

Early life and adulthood stressor simple slopes for food addiction. Simple slopes results indicate the steepest slopes for those with lower (−1 SD; dotted line) and mean levels (dashed line) of adulthood life stress exposure, as compared to those with higher adulthood life stress exposure (+1 SD; solid line). Individuals with lower adulthood life stress exposure and greater early life stress exposure reported the most food addictive behavior, whereas those reporting lower adulthood stress and lower early life stress exposure reported the least food addictive behavior. Individuals with greater adulthood life stress exposure did not report differences in food addictive behavior based on early life stress exposure. Mean centered values are presented on the x-axis. SD: Standard deviation.
