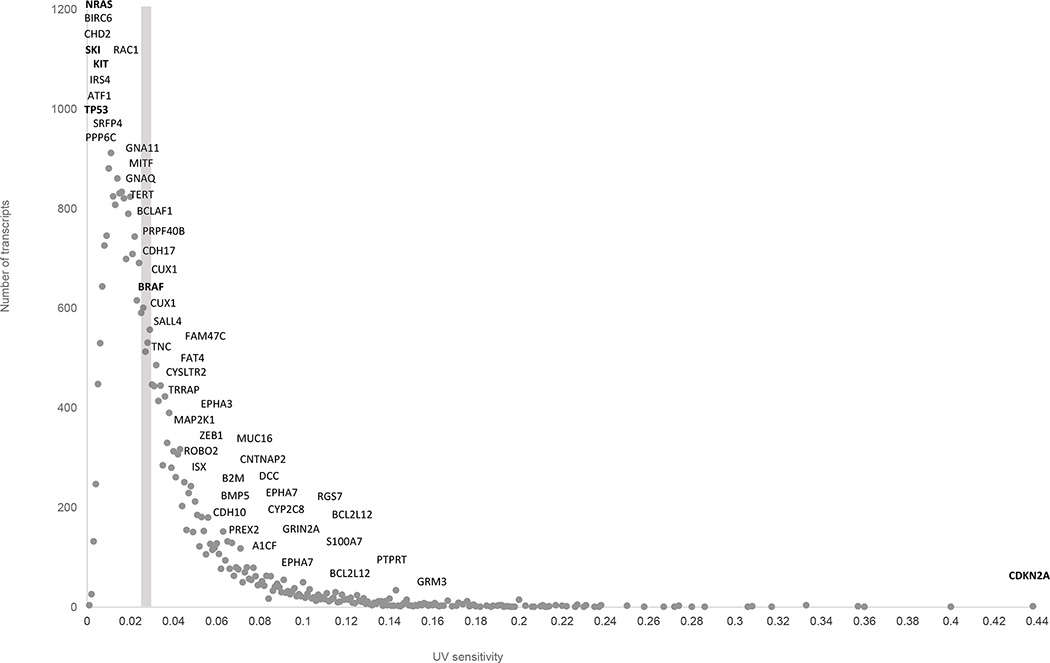
Figure 2.
The distribution of human transcripts by UV-sensitivity. Dark gray circles indicate the number of transcripts in a given category of UV sensitivity. Names of known melanoma genes are shown with the positions corresponding to their UV-sensitivity. The gray vertical bar indicates the average UV sensitivity for all human transcripts.

