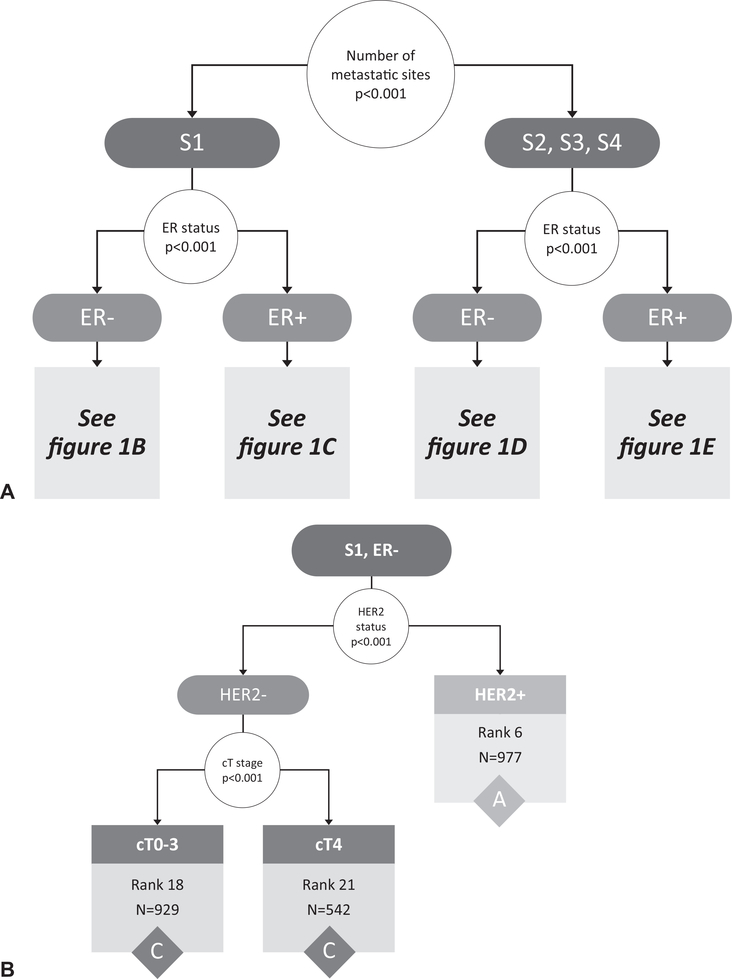
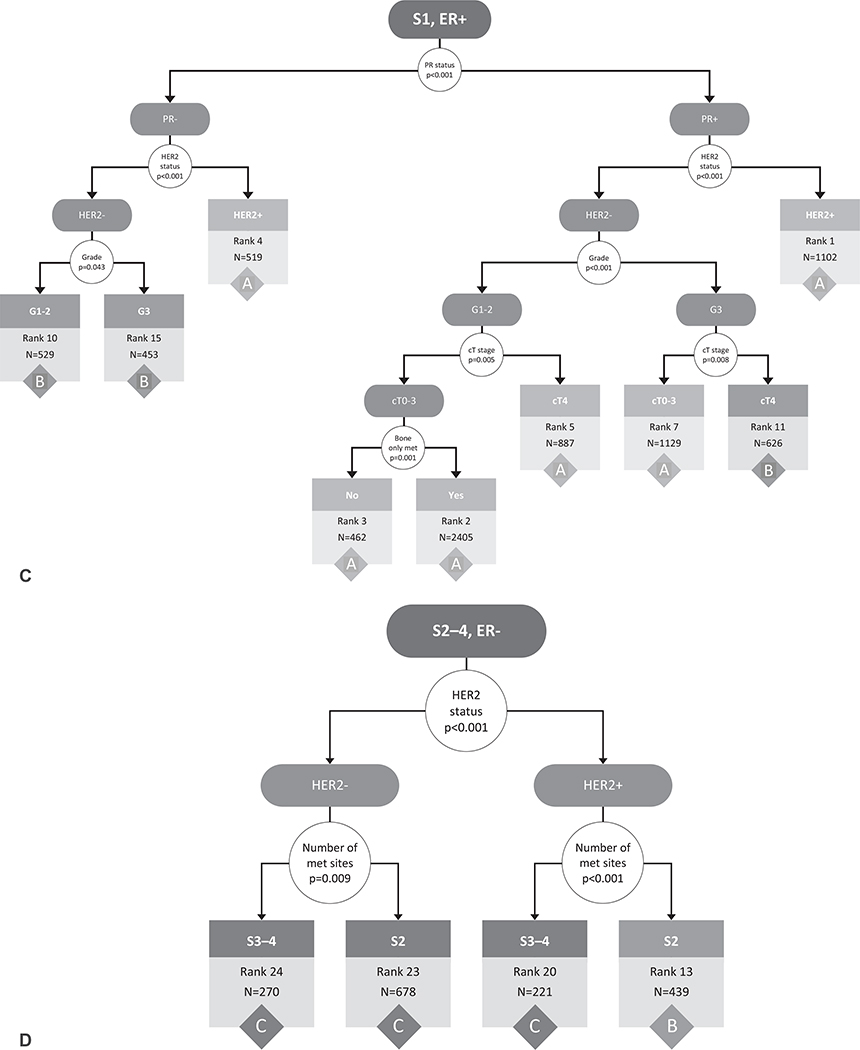
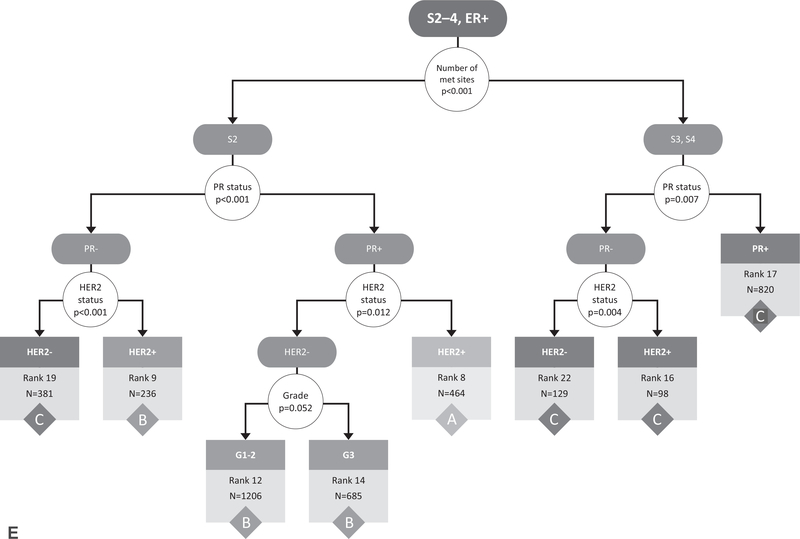
FIGURE 1.
Recursive partitioning tree created based on the following covariates in the original data cohort: clinical T stage (0/1/2/3/4), clinical N stage (0/1/2/3), tumor grade (1/2/3), ER (+/−), PR (+/−), HER2 (+/−), number of metastatic sites (1/2/3/4), and bone-only metastases (yes/no). The initial partitioning variables (number of metastatic sites and ER status) are shown in (A), whereas the continued partitioning for those with 1 metastatic site (B, C) and those with >1 metastatic site (D, E) are shown separately. Results based on adults with de novo metastatic breast cancer from the National Cancer Data Base (2010–2013). S indicates number of metastatic sites, G indicates grade, B indicates bone only metastases yes/no. White circles represent decision points, with arrows directing to potential outcomes for the decision. Terminal nodes with associated rankings and count (N) within that group, are represented by boxes color-coded according to final stage grouping (A/B/C). Rank assigned based on 3-year survival rates (listed in Table 1) from highest/best to lowest/worst (ie, rank 1 has the highest survival rates and rank 24 has the lowest). ER indicates estrogen receptor; HER2, human epidermal growth factor receptor 2; PR, progesterone receptor.


