Fig. 6.
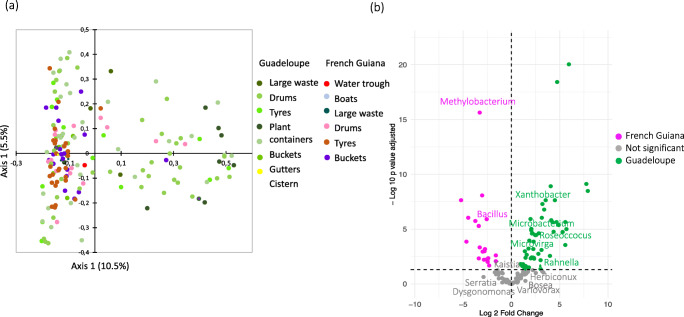
Spatial structuration and variability of microbiota associated with Aedes aegypti larvae. a Principal coordinate analysis plots based on Bray Curtis dissimilarity distances. Dots correspond to the breeding sites sampled arrayed according to the similarity of their microbiota. b Volcano plot for differential bacteria genera abundance in larvae between Guadeloupe and French Guiana. Each dot represents a bacterial genus found in the samples and the most abundant bacterial genera, with a significant fold-change between the two territories (P < 0.05) are labelled

