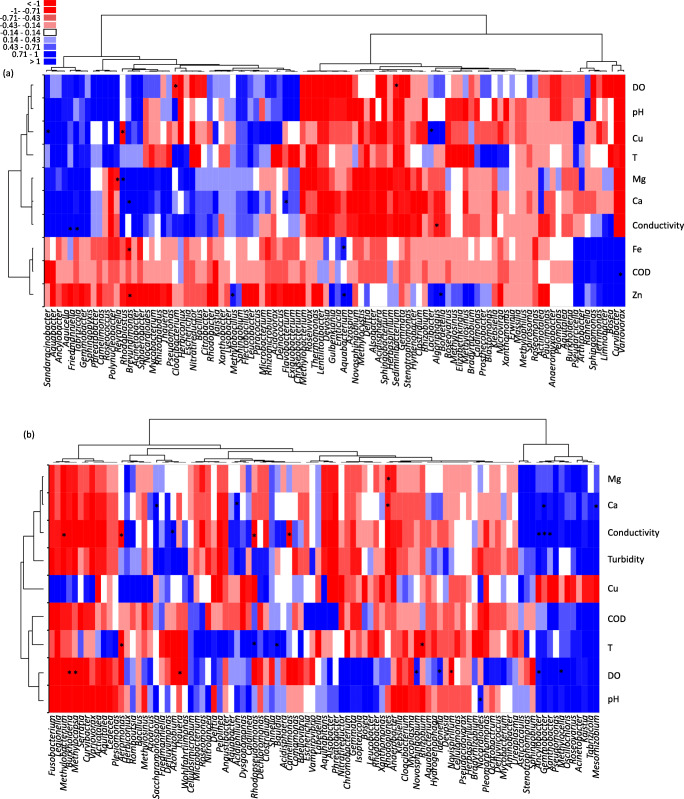
Fig. 7.
Heat map of correlations found by multivariate regression analysis between the 100 most abundant bacteria genera associated to Aedes aegypti breeding sites water (a) and larvae (b) (columns), and the physicochemical parameters retained after canonical correlation analysis (rows). Blue squares indicate a positive correlation in relative abundance, white squares indicate absence of correlation and red squares indicate negative correlations. The intensity of the colour corresponds to the magnitude of the (log)-fold change. Asterisks indicate significant correlations between a given bacteria genera and a physicochemical parameter (P < 0.05). COD chemical oxygen demand, DO dissolved oxygen, Cu copper, Fe iron, Zn zinc, Ca calcium

