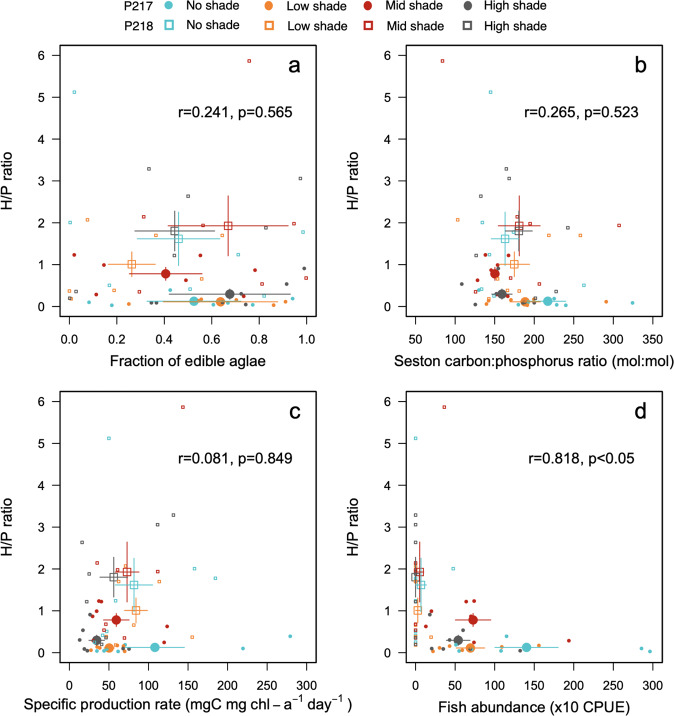
Fig. 3. Relationships between H/P mass ratio and environmental variables.
H/P mass ratio plotted against edible phytoplankton fraction (a), seston carbon to phosphorus (C:P) ratio (b), specific production rate (c), and fish abundance (d) during the experiment in no-shade (blue), low-shade (orange), mid-shade (red), and high-shade (gray) treatments in pond 217 (circles) and 218 (squares). In each panel, small symbols denote values at each sampling date, and large symbols denote the mean values among the sampling dates. Bars denote standard errors on the means (n = 7 sampling date in each section). Correlation coefficients (r) with p values between the mean values are inserted in each panel.

