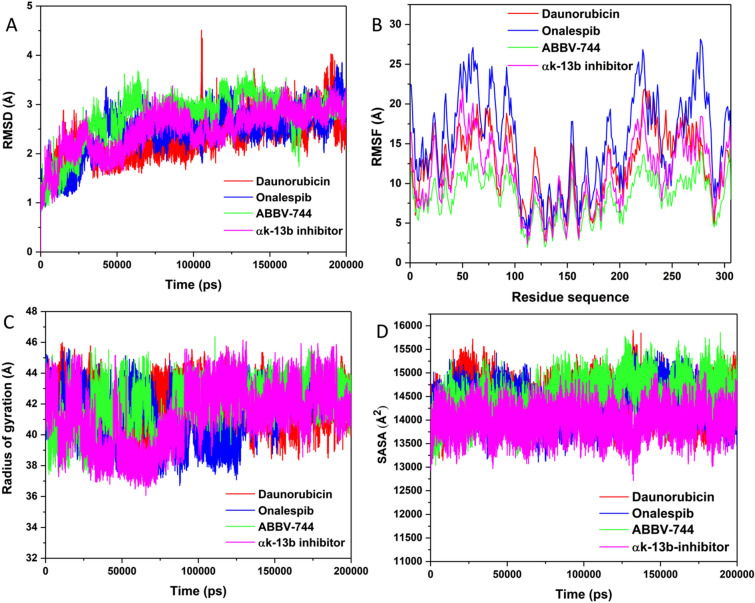
Figure 5.
Structural dynamics of Mpro enzyme-ligand complexes (Daunorubicin in red, Onalespib in blue, ABBV-744 in green and αk-13b inhibitor in magenta) during 200 ns of MD simulations. (A) Cα backbone RMSD in Å of all the selected compounds bound to Mpro enzyme; (B) Values of RMSF in Å plotted against residue number for all the selected compounds bound to Mpro enzyme; (C) Rg values after compound binding; and (D) SASA values of Cα backbone atoms.

