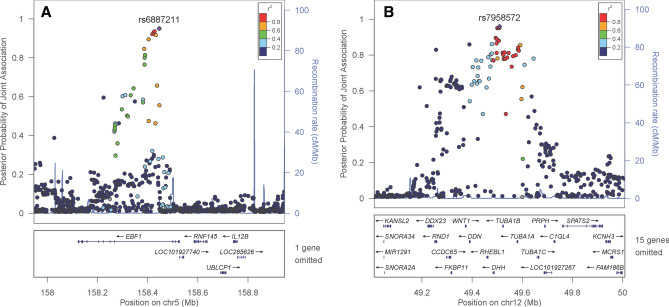
Figure 2.
Regional plots of novel pleiotropic loci associated with birthweight and childhood obesity traits. (A) rs6887211 (EBF1) locus association with both birth weight and childhood body mass index (B) rs7958572 (LMRB1L) locus associated with both birthweight and childhood obesity or childhood body mass index. The horizontal axes cover a region 500 kb upstream and downstream from the reference SNP. The vertical axes denote the joint association probabilities of the SNPs with both birthweight and childhood obesity traits. The purple triangles denote the index SNPs (rs6887211 in EBF1 and rs7958572 in LMRB1L). All other colored points denote the surrounding SNPs in that region, and they are colored based on their linkage disequilibrium (r2) with the reference SNP. The box at the bottom shows genes that fall in the region.

