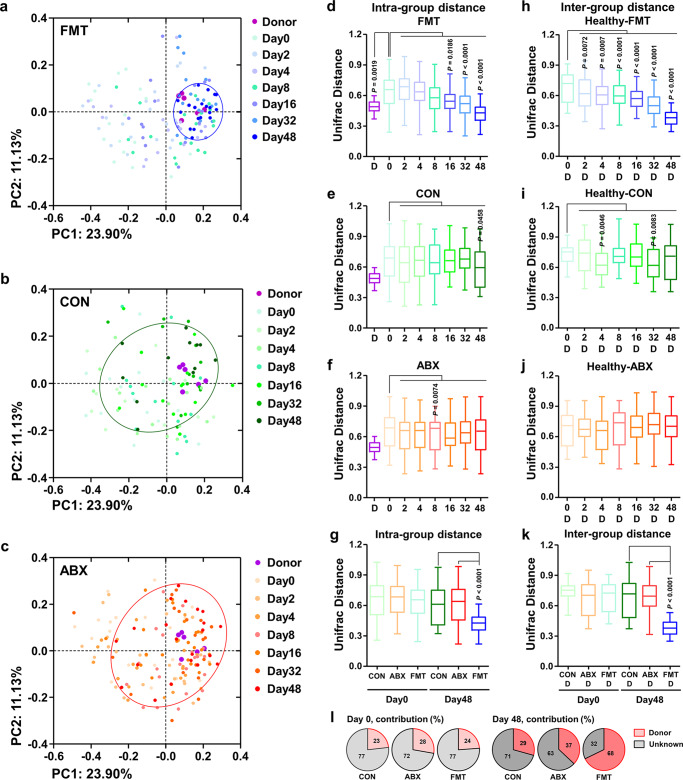
Fig. 2. Changes in the fecal bacterial profiles of diarrheic calves following the commencement of treatment.
a–c PCoA, based on the weighted UniFrac distance matrix, of the bacterial 16S rRNA gene sequence data for fecal samples collected 0, 2, 4, 8, 16, 32, and 48 days after the start of treatment are shown for CON (n = 108), ABX (n = 176), and FMT (n = 166) calves. The PCoA scatterplot shows the bacterial communities in the CON, ABX, and FMT calves in blue, red, and green, respectively. d–f Within-group microbial dissimilarity values (calculated based on the weighted UniFrac distance matrix) for the FMT (d, n = 20), CON (e, n = 14), and ABX (f, n = 23) calves 0, 2, 4, 8, 16, 32, and 48 days after the start of treatment. g Within-group microbial dissimilarity values for the FMT (n = 20), CON (n = 14), and ABX (n = 23) calves on days 0 and 48. h–j Intergroup microbial dissimilarity values (calculated based on the weighted UniFrac distance matrix) for healthy donor calves and FMT (h, n = 20), CON (I, n = 14), and ABX (j, n = 23) calves 0, 2, 4, 8, 16, 32, and 48 days after the start of treatment. k Intergroup microbial dissimilarity values for the healthy donor calves and the CON (n = 14), ABX (n = 23), and FMT (n = 20) calves on days 0 and 48. Microbial dissimilarity values, based on weighted UniFrac distance matrices, for each group, are presented as box plots. The lines, boxes, and whiskers in the box plots represent the median, and 25th, and 75th percentiles, and the min-to-max distribution of replicate values, respectively. l Results of Sourcetracker analysis showing the average contributions of donor feces to the bacterial communities in the CON (n = 14), ABX (n = 23), and FMT (n = 20) calves on days 0 and 48. Source: gut microbiome of donor’s calves; sink: CON, ABX, and FMT calves. The P values were determined using the Mann–Whitney U test (two-tailed) (d–l). CON control, ABX antibiotic, FMT fecal microbiota transplantation, D donor. Source data are provided as a Source Data file.

