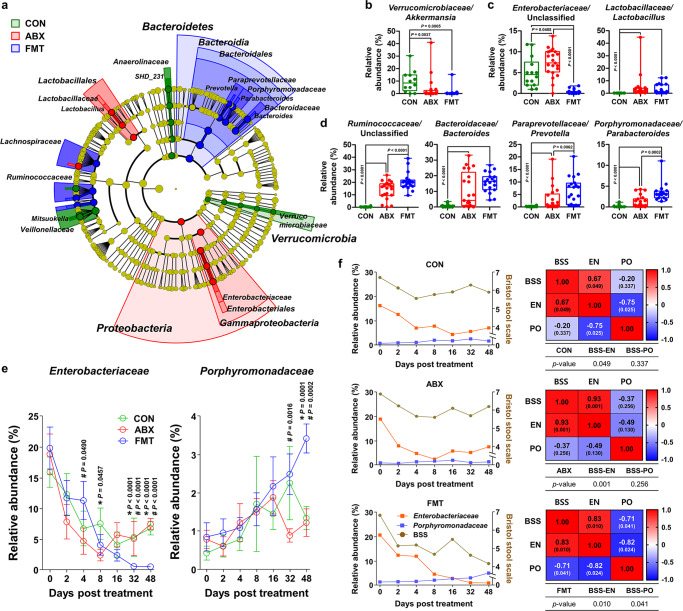
Fig. 3. Discriminating microbial taxa associated with the incidence of diarrhea, and correlation analysis of gut Enterobacteriaceae or Porphyromonadaceae with the incidence of diarrhea.
a The linear discriminant analysis effect size (LEfSe) circular cladogram generated from the day 48 metataxonomic data identified the discriminating taxa for the CON (n = 14), ABX (n = 23), and FMT (n = 20) groups (shown in different colors). b–d Relative abundance of the predominant taxa in ASV feature table compiled using the SILVA database for the CON (b, n = 14), ABX (c, n = 23), and FMT (d, n = 20) groups, presented as bar charts and dot plots. The lines, boxes, and whiskers in the box plots represent the median, and 25th, and 75th percentiles, and the min-to-max distribution of replicate values, respectively. Data are shown as mean ± SEM and were analyzed using the Mann–Whitney U test (two-tailed). e Changes in the relative abundance of the family Enterobacteriaceae (left) and Porphyromonadaceae (right) with time (CON, n = 14; ABX, n = 23; FMT, n = 20). Data are shown as mean ± SEM. The P values were determined using the Mann–Whitney U test (two-tailed). *Comparison of the CON and FMT groups; #comparison of the ABX and FMT groups; and †comparison of the CON and ABX groups. f The relative abundances of the families Enterobacteriaceae (left y-axis, orange) and Porphyromonadaceae (left y-axis, blue), and the BSS (right y-axis, brown) in each group over time (left panel). The Pearson correlation coefficients for multiple variants and statistical significance (two-tailed) for the relationships among BSS and the relative abundances of the families Enterobacteriaceae and Porphyromonadaceae were calculated (right panel). CON control, ABX antibiotic, FMT fecal microbiota transplantation, BSS Bristol stool scale, EN Enterobacteriaceae, PO Porphyromonadaceae. Source data are provided as a Source Data file.

