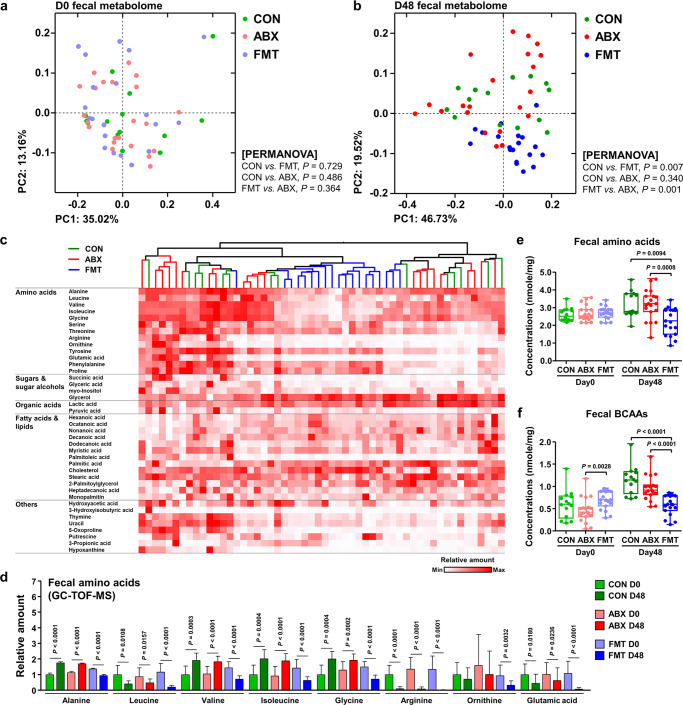
Fig. 4. Changes in the fecal metabolome profile of the diarrheic calves following FMT.
The metabolomes of the calves were analyzed using GC-TOF-MS and clustered using PCoA, based on the Bray–Curtis dissimilarity matrix. a The fecal metabolome profiles of calves before (day 0, n = 54) and b after (day 48, n = 54) treatment. The metabolome profiles for the CON, ABX, and FMT groups are shown in the same colors. The data were analyzed using PERMANOVA, with 999 permutations. c The abundant metabolites in day 48 samples were clustered using a UPGMA dendrogram, based on the Bray–Curtis dissimilarity matrix, and the relative abundances are represented in a heatmap. Samples from the same groups are shown in the same color. d The relative quantities of rectal metabolites are displayed as bar charts and dot plots (day 0, n = 54; day 48, n = 54). e Amino acid concentrations in the fecal samples obtained from calves in each group on days 0 (n = 54) and 48 (n = 54). The amino acid concentrations were measured by an enzymatic method using an l-amino acid quantitation kit, and are displayed as box and dot plots. The lines, boxes, and whiskers in the box plots represent the median, and 25th, and 75th percentiles, and the min-to-max distribution of replicate values, respectively. f The branched-chain amino acid (BCAA) concentrations in the fecal samples obtained from calves at days 0 (n = 54) and 48 (n = 54). The concentrations of the BCAAs are displayed as box and dot plots. The lines, boxes, and whiskers in the box plots represent the median, and 25th, and 75th percentiles, and the min-to-max distribution of replicate values, respectively. Data are shown as mean ± SEM and were analyzed using the Mann–Whitney U test (two-tailed). CON control, ABX antibiotic, FMT fecal microbiota transplantation, BCAAs branched-chain amino acids. Source data are provided as a Source Data file.

