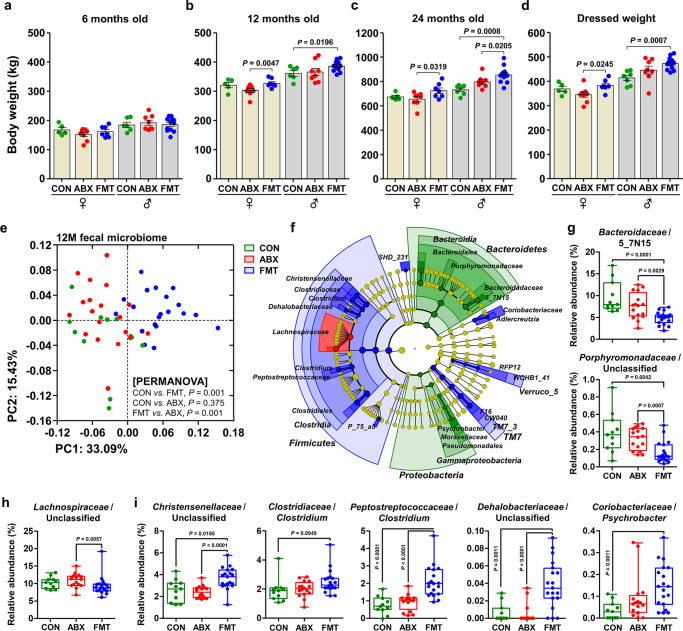
Fig. 5. The effect of FMT-driven gut microbial assembly on growth performance.
a–c Body mass of the cattle (n = 50) at 6 (a), 12 (b), and 24 (c) months of age. d Dressed mass of the cattle at 24 months of age (n = 50). Bar graphs and dot plots are colored according to sex and treatment. e Metataxonomic profiles of the gut microbiome in the 12-month-old cattle (n = 50). PCoA of the rectal bacterial 16S rRNA gene sequences, based on the weighted UniFrac distance matrix. The data were analyzed using PERMANOVA, with 999 permutations. f The enriched microbial taxa in each group of 12-month-old cattle were identified using LEfSe and are presented using the circular cladogram. The discriminating taxa for each group are denoted in different colors. g–i Relative abundances of the discriminating taxa were compiled in the feature ASV table, based on the SILVA database for the CON (g, n = 11), ABX (h, n = 19), and FMT (i, n = 20) groups, and are presented as box and dot plots. The lines, boxes, and whiskers in the box plots represent the median, and 25th, and 75th percentiles, and the min-to-max distribution of replicate values, respectively. Data are shown as mean ± SEM and were analyzed using the Mann–Whitney U test (two-tailed). FMT fecal microbiota transplantation. Source data are provided as a Source Data file.

