
Fig. 4. FLIM analysis of FancJ and RTEL1 expression in mutant MEF and U2OS cells using DAOTA-M2.
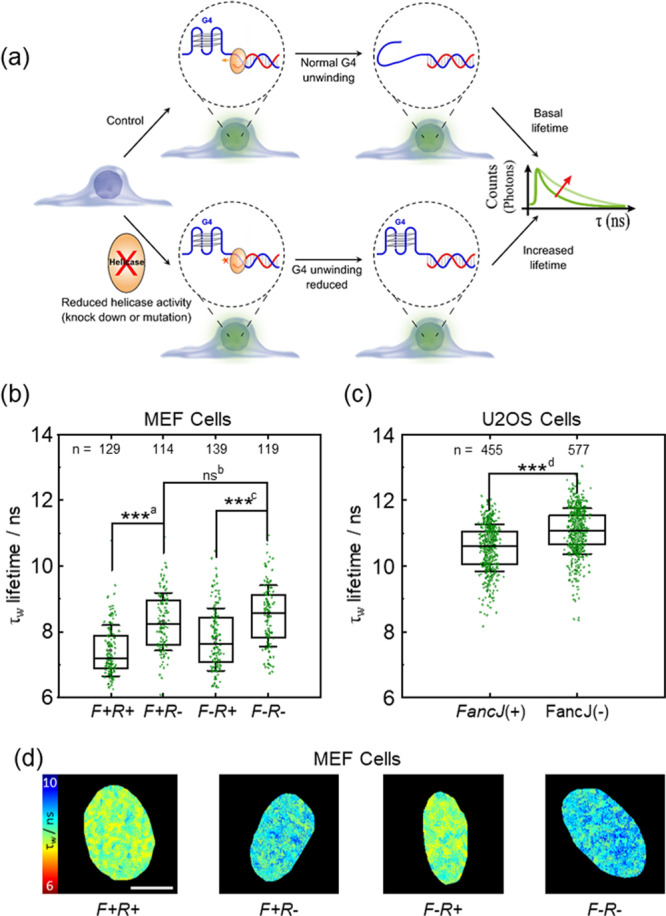
F + R + = FancJ(+)/RTEL1(+), F + R− = FancJ(+)/RTEL1(−), F−R + = FancJ(−)/RTEL1(+), and F−R− = FancJ(−)/RTEL1(−). a Schematic showing how reduced FancJ or RTEL1 helicase expression results in longer DAOTA-M2 lifetimes (τw). b Box plot of mean nuclear lifetimes (τw) for F + R+, F + R−, F−R+ and F−R− MEF cells. Cells were incubated with a null adenovirus (R+), or incubated with CRE adenovirus (R−) to delete RTEL1. Results from n cells as stated next to each box, over two independent experiments. c Box plot of mean nuclear lifetimes (τw) for U2OS cells transfected with siLucif [FancJ(+)], or FancJ siRNA [FancJ(−)] to knock-down FancJ. Results from n cells as stated next to each box, over two independent experiments. d FLIM maps of cells from b displayed between 6 (red) and 10 (blue) ns and recorded at 512 × 512 resolution, representative of the cells from two independent experiments shown in b. Scale bars: 10 µm. Significance: ns p > 0.05, *p < 0.05, **p < 0.01, ***p < 0.001. ap = 1.1 × 10⁻¹⁴, t = −8.3, DF = 228. bp = 1.4 × 10⁻¹, t = −1.5, DF = 231. cp = 4.5 × 10⁻⁹, t = −6.1, DF = 252. dp = 2.7 × 10⁻²⁶, t = −11.6, DF = 959. Source Data are available as a Source Data file for Fig. 4b, c.