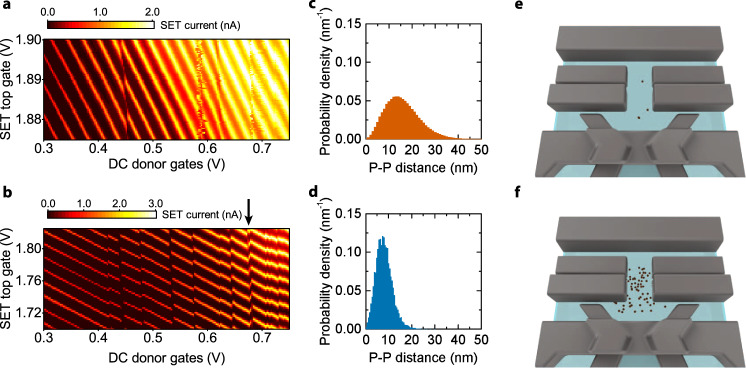
Fig. 3. Comparison of two ion implantation strategies.
a, b The current through a single-electron transistor (SET) displays characteristic Coulomb peaks, appearing as bright diagonal lines, as a function of the gate voltages. The presence of a donor coupled to the SET is revealed by discontinuities in the pattern of Coulomb peaks, occurring when the donor changes its charge state. a Charge stability diagram (i.e., SET current vs. SET and donor gates voltages) in a device where P molecular ions were implanted at a fluence corresponding to 5 × 10¹⁰ donors/cm2, compared to b a device where P+ single ions were implanted with high fluence, yielding 1.25 × 10¹² donors/cm2. The much higher number of observable charge transitions in b is consistent with the higher donor density in the device. An arrow indicates a region where the charge transitions of two different donors cross each other (see also Fig. 4a). c Simulated probability density of inter-donor distance for P molecule implantation at the fluence of 5 × 10¹⁰ donors/cm2. d A much higher probability density for small inter-donor distances is obtained for P+ implantation at the fluence 1.25 × 10¹² donors/cm2. The device sketches show simulated random placements of donors for the P molecular (e), and the high-fluence P+ ion (f) implantation strategies. Red dots represent P+ ions that crossed through the 8 nm thick SiO2 dielectric layer and stopped in the Si crystal, thus becoming active substitutional donors.

