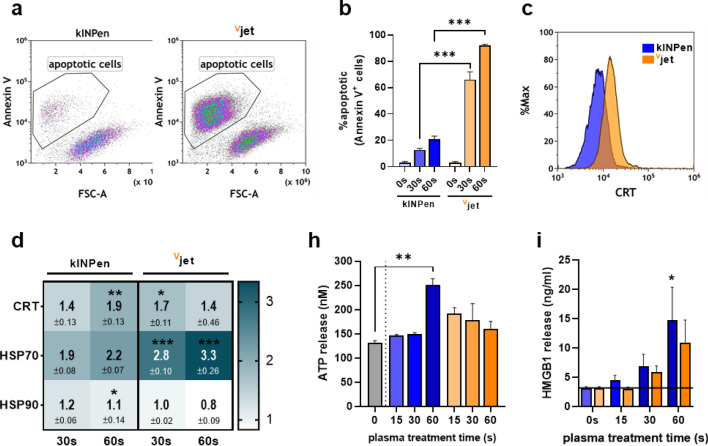
Figure 3.
Immunogenic cell death in cancer cells following plasma treatment. (a) representative flow cytometry dot plots of annexin V + cells 24 h after plasma treatment and (b) quantification thereof; (c) representative flow cytometry intensity histogram of CRT surface expression and (d) quantification of ecto-CRT, HSP70, and HSP90 normalized to untreated controls; quantification of (e) ATP and (f) HMGB1 release in cell culture supernatants after plasma treatment. Data are representative of three independent experiments. Statistical analysis was performed using two-way Anova (*p < 0.05; **p < 0.01; ***p < 0.001).

