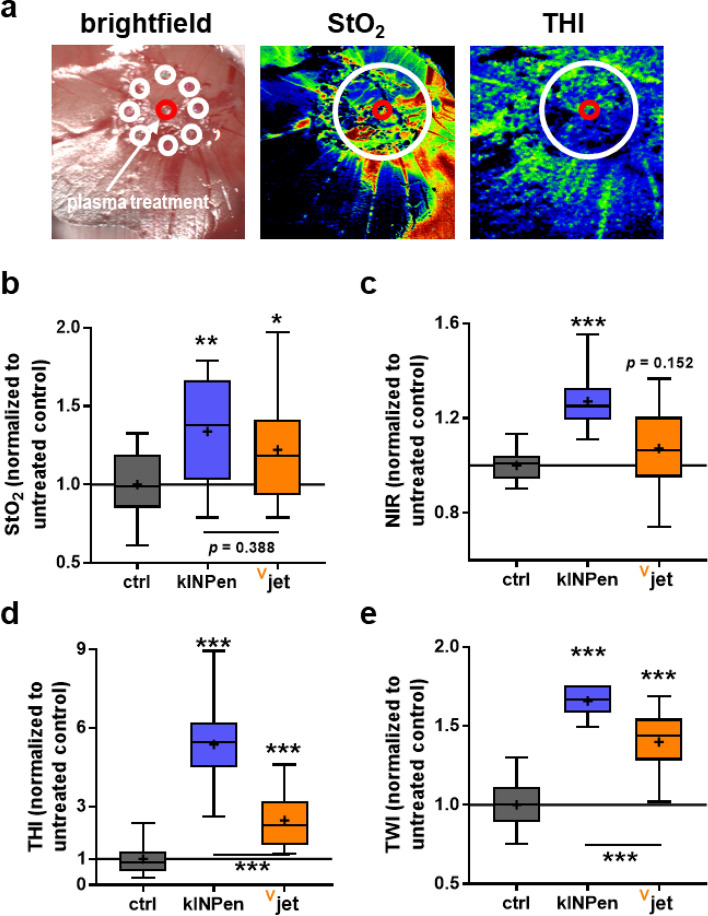
Figure 6.
Assessment of the irritation potential using hyperspectral imaging of the CAM. (a) representative bright field and false-colored RGB images of kINPen treated CAM, and the red circle represents the plasma treatment site while the white circles represent the region in which eight ROIs were placed for quantification; (b–e) spectral data analysis to evaluate superficial tissue oxygenation (StO2, b), near-infrared perfusion index (NIR, c), tissue hemoglobin index (THI, d), and tissue water index (TWI, e). Spectral absorbance was normalized to untreated CAM. Data are min–max boxplots from 5 eggs per group. Statistical analysis was performed using one-way anova (***p < 0.001).

