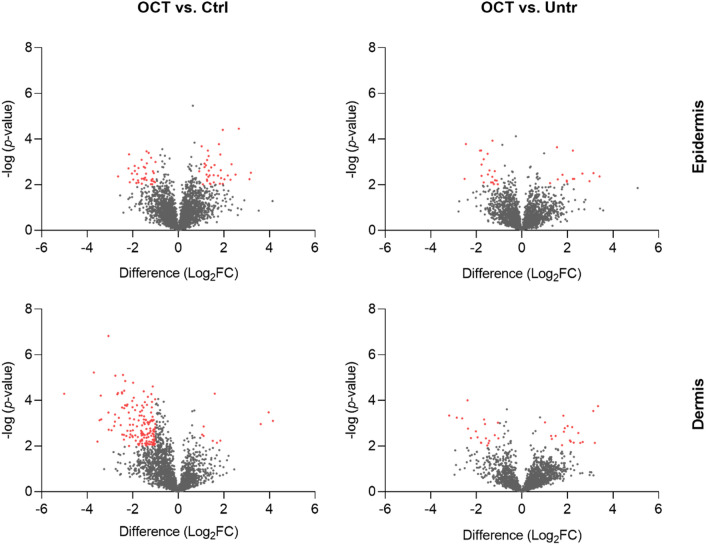
Figure 5.
More proteins are significantly differentially regulated upon OCT treatment in the dermis than in the epidermis. Full skin biopsies of healthy female donors (age range: 36–44 years, n = 3) were TS, treated with OCT, control gel or left untreated and cultivated for 48 h. Subsequently, epidermis was detached from dermis and the two compartments were separately prepared for LC–MS analysis. Volcano plots show differences in LFQ values (fold change, logarithmic scale to the base of two) on the x-axis including their corresponding p-values (logarithmic scale) on the y-axis. Proteins marked in red are significantly differentially regulated (Log2FC < -1 = downregulated; Log2FC > 1 = upregulated) in OCT treated TS samples compared to control gel-treated TS samples or untreated TS samples. Data presented in the plots was generated performing a two-sided t-test (p < 0.05) using Perseus and Volcano plots were generated with Graphpad Prism using exclusively proteins with a p-value < 0.01.

