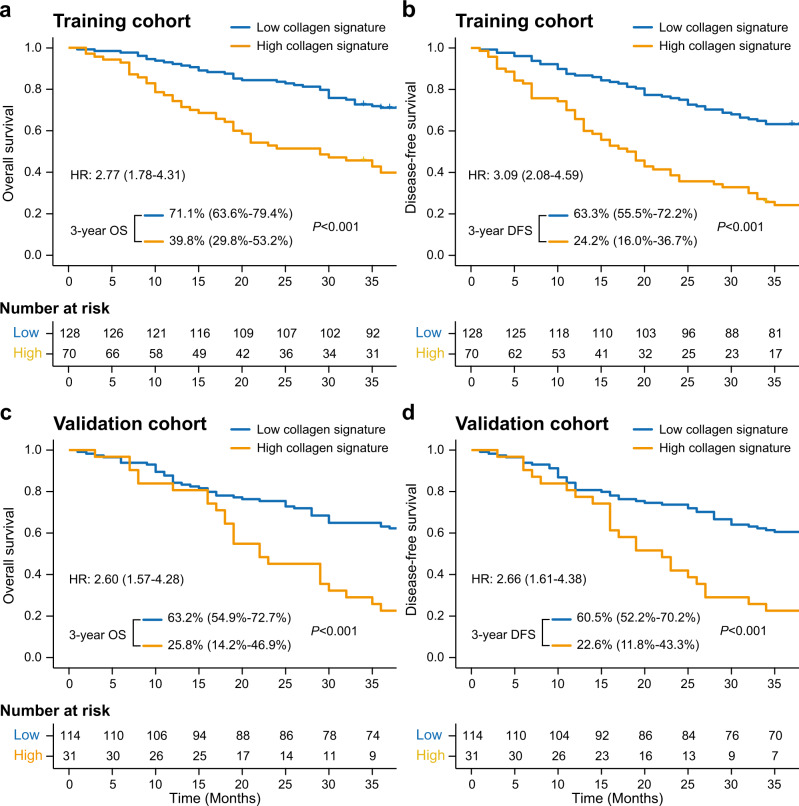
Fig. 3. Kaplan–Meier survival analysis of the training and validation cohorts grouped by the collagen signature.
a Three-year OS comparison between the high and low collagen signatures in the training cohort. b The 3-year DFS comparison between the high and low collagen signatures in the training cohort. c The 3-year OS comparison between the high and low collagen signatures in the validation cohort. d The 3-year DFS comparison between the high and low collagen signatures in the validation cohort. The comparisons of OS and DFS between two subgroups are performed using a two-sided log-rank test. OS, overall survival; DFS, disease-free survival; HR, hazard ratio.

