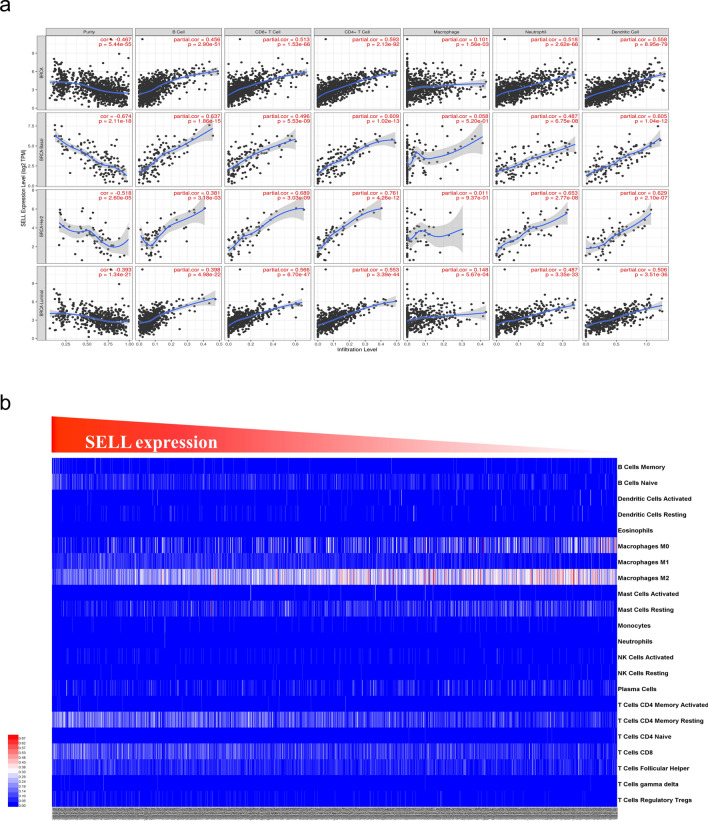
Fig. 5.
Association of SELL expression with tumor immunity. a Scatter plot represents the association of SELL expression with the tumor-infiltrating immune cells generated using TIMER web server. Analysis was done on total sample (first panel), basal, Her2 + and luminal subtypes of breast cancer. Each dot represents a single breast tumor samples. b CIBERSORT analysis for association of SELL expression and abundance of 22 types of immune cells in TCGA-BRCA dataset. Samples were arranged in order of SELL expression from highest (left) to lowest (right)

