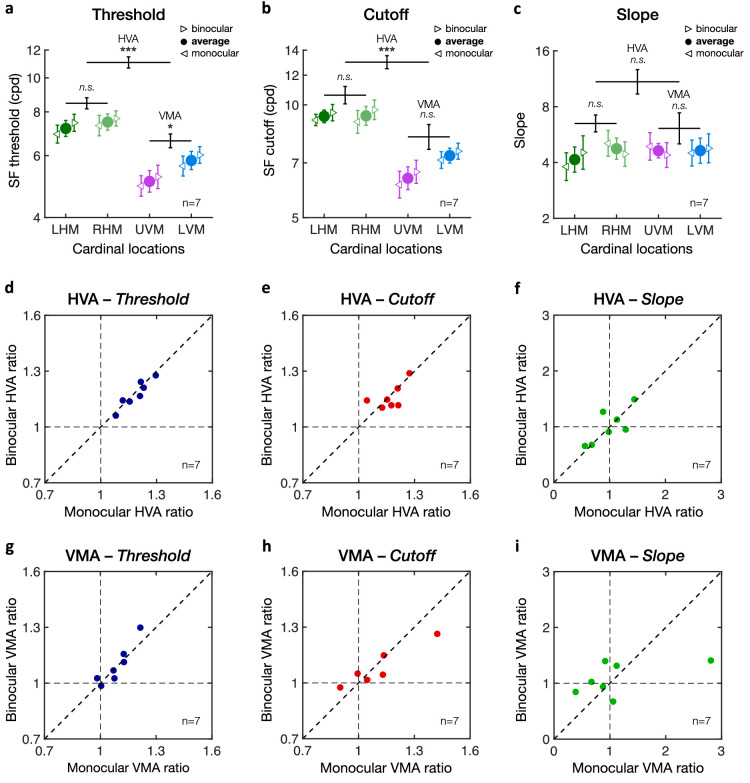
Figure 10.
HVA and VMA under binocular and monocular viewing conditions. Averaged (a) SF threshold, (b) SF cutoff, and (c) slope estimates at each of the four cardinal locations (LHM/RHM = left/right horizontal meridian; UVM/LVM = upper/lower vertical meridian). Leftward and rightward triangles correspond to the monocular and binocular viewing condition, respectively. Filled circles correspond to average estimates across viewing conditions. Error bars correspond to ± 1 SEM. Horizontal lines reflect comparisons between the LHM and RHM, between the HM and VM (i.e., HVA), and between the UVM and LVM (i.e., VMA) for the combined binocular-monocular average data points, with error bars representing ± 1 SE of the mean difference. *p < 0.05, **p < 0.01, ***p < 0.001. (d–f) Scatterplots of individual participants’ HVA ratios (HM/VM) for (a) SF threshold, (b) SF cutoff, and (c) slope estimates. (g–i) Scatterplots of individual participants’ VMA ratios (LVM/UVM) for (g) SF threshold, (h) SF cutoff, and (i) slope estimates.

