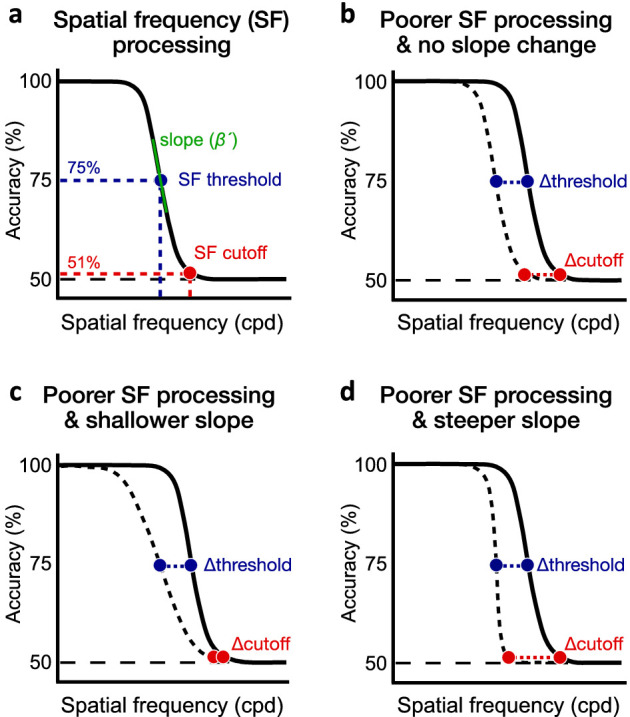
Figure 2.

Spatial frequency (SF) processing. (a) Performance in SF discrimination decreases as stimulus SF increases. For each polar angle location, we estimated the 75%-correct SF threshold (blue dot) and SF cutoff (red dot) corresponding to the SF at which participants were near chance level (i.e., 51% correct). We also estimated the slope (β) of the psychometric function, which was converted into the maximum slope estimate (β´) (see Methods). (b) Differences in SF processing between two locations (e.g., UVM and LVM) could reflect a shift of the psychometric function without a change in slope. Such change would result in a similar difference in SF threshold and SF cutoff. (c, d) Asymmetries in SF processing could also be characterized by a change in the slope of the psychometric function. Relative to a similar change in SF threshold in both panels, a (c) shallower or (d) steeper slope would result in the change in SF cutoff to be less or more pronounced, respectively.
