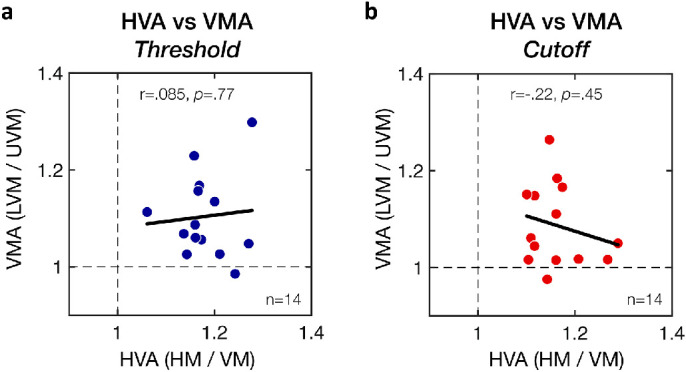
Figure 5.

Lack of correlation between the HVA and VMA. HVA and VMA ratios estimated from (a) SF threshold estimates or (b) SF cutoff estimates. Each data point corresponds to an individual participant's HVA and VMA ratios, with the solid black lines corresponding to Pearson correlations.
