
Figure 8.
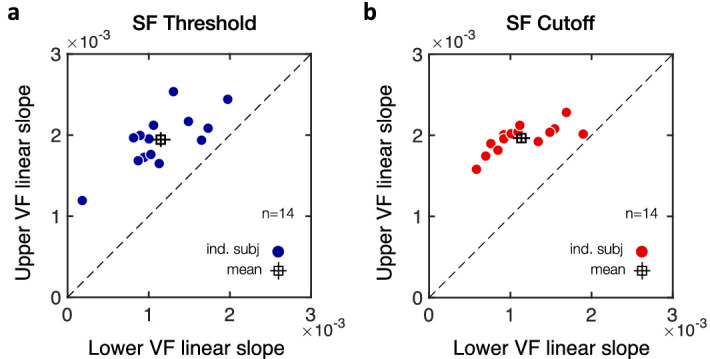
Individual linear slope estimates from the linear mixed-effects models. Scatterplots of individual linear slope estimates with angular distance from the VM show a steeper linear slope in the upper than lower visual field (VF) in all participants (n = 14), for both (a) SF threshold and (b) SF cutoff estimates. Filled circles correspond to individual participants and the open square symbol to the mean ± 1 SEM.