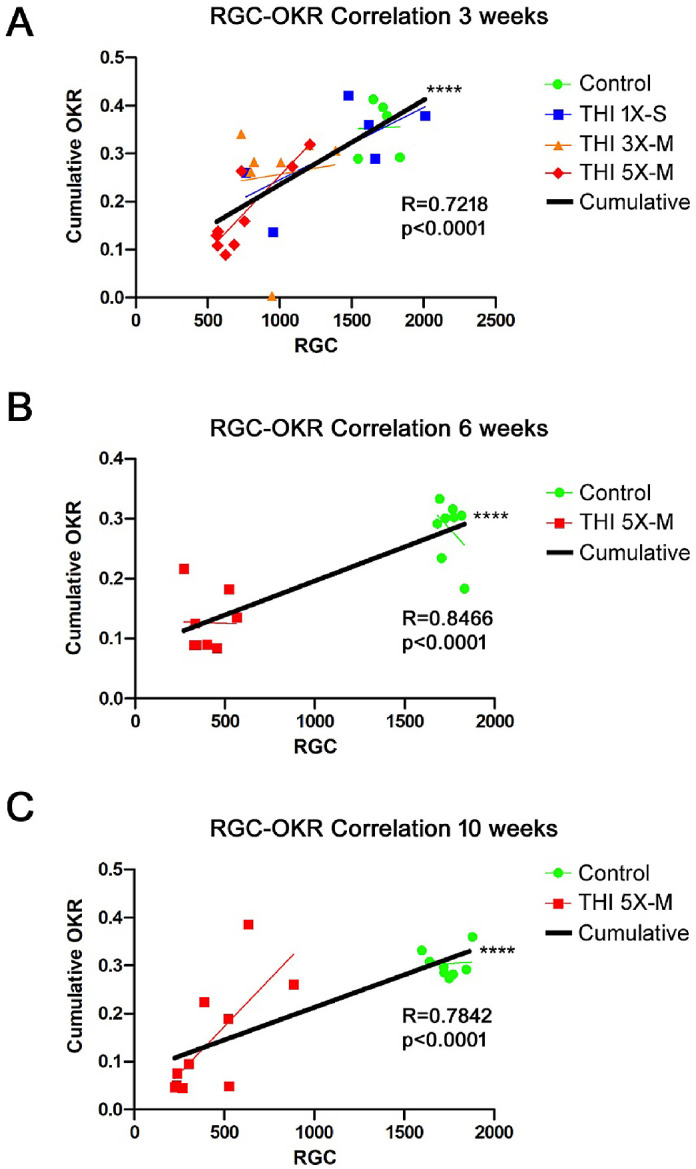
Figure 6.

OKR scores correlate with RGC loss. (A) Cumulative OKR scores (total score added from each measured time point) from each mouse in the control, 5×-M, 3×-M, and 1×-M groups over 3 weeks were plotted against the number of surviving RGCs present on day 21. Results show a significant (****P < 0.0001) positive correlation between RGC number and OKR score. (B) Cumulative OKR scores for control and 5×-M mice over 6 weeks plotted against RGC numbers on day 42 showed a significant (****P < 0.0001) positive correlation between RGC number and OKR score. (C) Cumulative OKR scores for control and 5×-M impacted mice over 10 weeks plotted against RGC numbers on day 70 showed a significant (****P < 0.0001) positive correlation between RGC number and OKR score.
