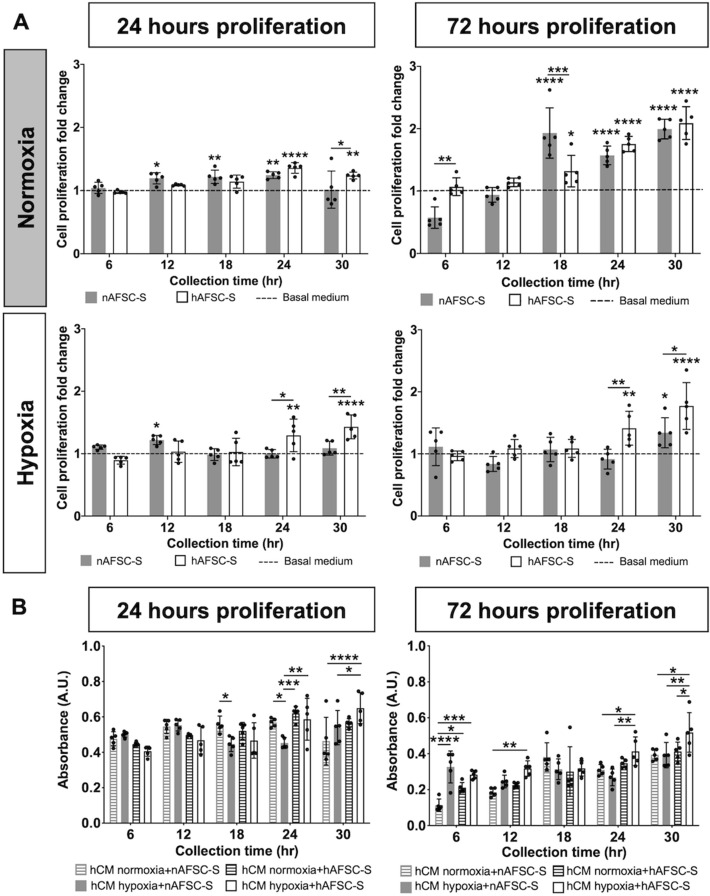
Figure 4.
Comparison of human cardiomyocyte (hCM) proliferation. Comparison of the MTS tetrazolium compound reduction in a colorimetric assay to asses hCM proliferation cultured for 24 or 72 h in normoxic (Normoxia) and hypoxic (Hypoxia) culture conditions with amniotic fluid stem cells secretome (AFSC-S) collected from normoxic (nAFSC-S) or hypoxic (hAFSC-S) conditions collected at 6 to 30 h. (A) Cell proliferation fold change evaluation of recorded values normalized to hCM proliferation values in control basal medium (basal MEMα; dashed line) and (B) absolute absorbance values cross parameter comparison. Data are expressed as means ± SD. n = 5. * above a bar graph indicates statistical significance between AFSC-S group and basal MEMα group. * above a line indicates statistical significance between nAFSC-S and hAFSC-S group. *p < 0.05, **p < 0.01, ***p < 0.001, ****p < 0.0001 by two-way ANOVA followed by Tukey’s post hoc test.

