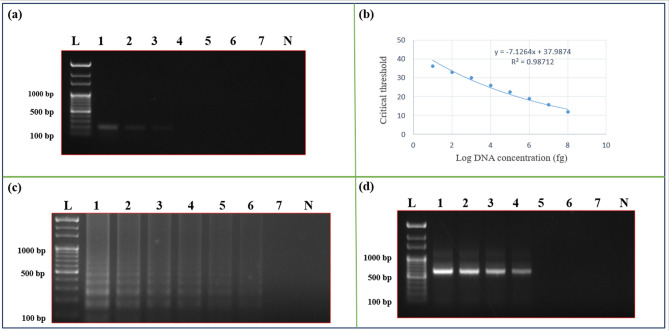
Figure 4.
Comparative analysis of PCR, qPCR, LAMP assay, and HAD for their sensitivity using Sarocladium oryzae specific primers. (a) The sensitivity of the PCR assay, the result was visualized in a 1% agarose gel. Where lane L indicates 1 Kb ladder (Thermo Scientific), lanes 1–7 indicates 10 ng, 1 ng, 100 pg, 50 pg, 10 pg, 100 fg, 50 fg, and lane N indicates negative control. (b) The sensitivity of the qPCR assay. The standard curve represents log10 of DNA concentration in fg against Ct (cycle threshold) values for different DNA concentrations. (c) The sensitivity of the LAMP assay. The result was visualized in a 2% agarose gel. Lanes (1 to 7) indicates template DNA concentrations (10 ng, 1 ng, 100 pg, 50 pg, 10 pg, 100 fg, and 50 fg); lane N indicates negative control. (d) The sensitivity of the HDA assay. The result was visualized in a 1% agarose gel. Lanes (1 to 7) indicates template DNA concentrations (10 ng, 1 ng, 100 pg, 50 pg, 10 pg, 100 fg, and 50 fg), lane N indicates negative control, and lane L indicates 1 kb ladder (Thermo Scientific).

