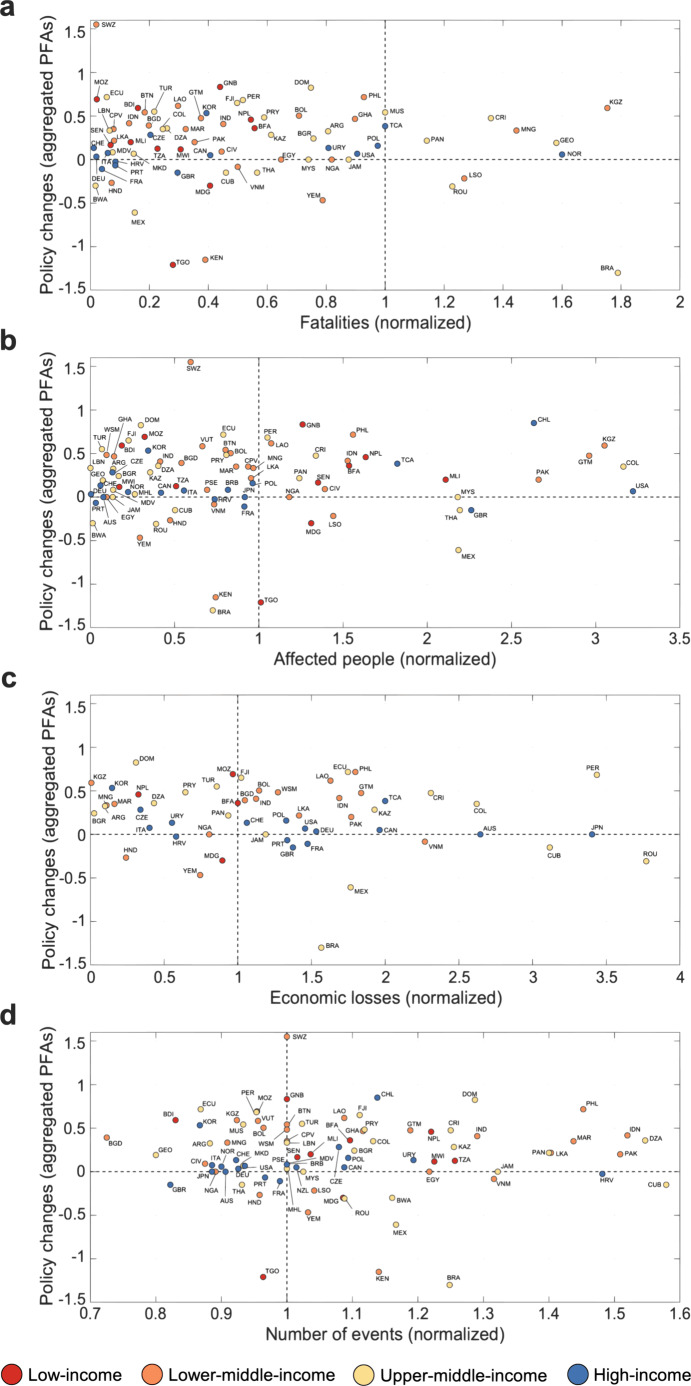
Fig. 1. Average aggregated policy changes in relation to natural hazard event frequency and severity measures.
Plots demonstrating the relationship between fatalities (a), affected people (b), economic loss (c), number of events (d), and average changes in aggregated HFA PFAs by income levels in the World Bank’s fiscal year 2015 (red = low income; orange = lower–middle income; yellow = upper–middle income; blue = high income). Country acronyms are provided in the Source Data file. Frequency and severity measures are normalized against the 30-year country baseline. Normalized index ≤1 indicates that hazards are less or equally frequent and severe as the 30-year baseline long-term average. Conversely, normalized index values >1 represent more frequent and severe events than the 30-year baseline. Frequency and severity scales have been shortened for readability, to the effect that some countries are excluded from a–d. Countries not shown in a: Chile (CHL, normalized fatality score = 2.54), Australia (AUS, 2.94), Japan (JPN, 3.27), and Samoa (WSM, 4.13); b: Uruguay (URY, normalized affected people score = 6.26) and Macedonia (MKD, 4.90); c: Chile (CHL, normalized economic loss score = 5.47), New Zealand (NZL, 7.68), Thailand (THA, 8.06), and Malaysia (MYS, 5.18); d: Turks and Caicos Islands (TCA, normalized number of events score = 2.0). Source Data are provided as a Source data file.

