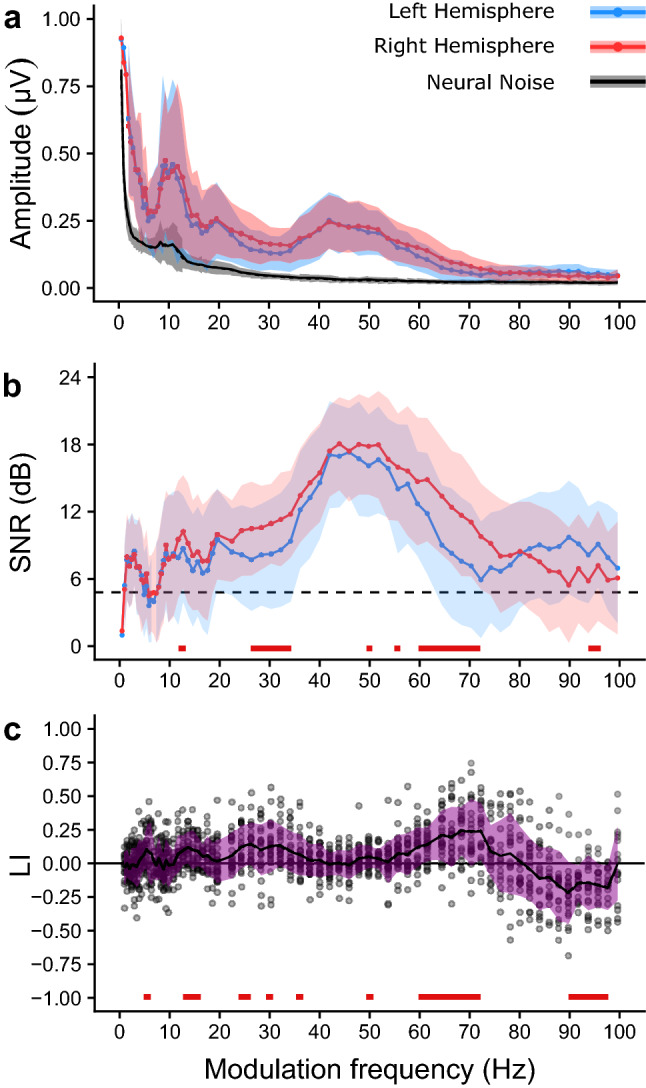
Figure 3.

The group average biased (a) amplitude, (b) signal-to-noise ratio (SNR), and (c) laterality index as a function of modulation frequency. The mean is represented by the solid line and the shaded area reflects the range between the mean ± one standard deviation. The solid black line and the gray area in panel A show the average neural background noise across channels ± one standard deviation, respectively. The individual LIs are represented by the dots in (c).
