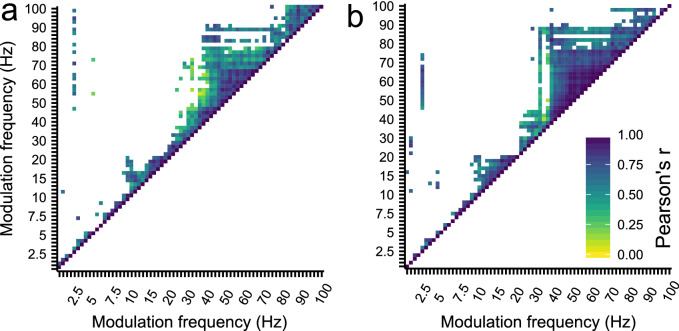
Figure 4.
The correlation matrix of the biased response amplitudes across modulation frequencies for (a) the left and (b) the right hemispheric channel. Only p < 0.01 and r > 0 is shown. Four distinct patterns are apparent from the correlation matrixes, namely the correlation between 2.5 Hz and ~ 50–100 Hz, between 8 and 10 Hz and 10–20 Hz, the correlation between ASSRs within the 40–90 Hz region, and finally the correlation between ASSRs within the 80–100 Hz region. These patterns indicated that the response magnitude to a specific modulation frequency are associated with the response magnitude of the ASSRs that fall within a specific cluster.

