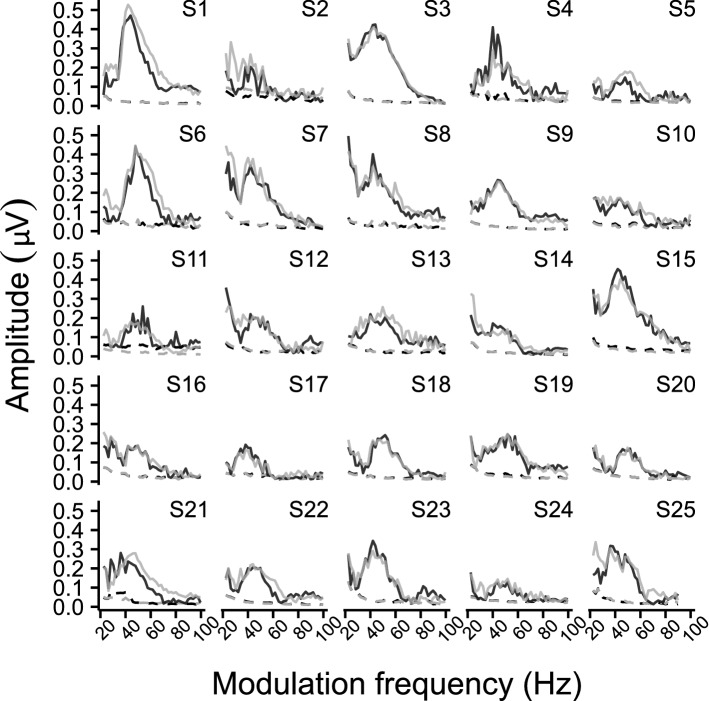
Figure 6.
Individual TMTFASSR within the 20–100 Hz region. The different panels show the biased response amplitude as a function of modulation frequency per subject. Solid lines represent the ASSR amplitude, whereas the dashed lines represent the neural background noise. The left and right hemispheric channel are shown in black and gray, respectively. Comparing the subject-specific TMTFASSR shows that all subjects had an increased ASSR magnitude, although differences exist across subjects, for ASSRs evoked with modulation frequencies ranging from 30 to 60 Hz and 80–100 Hz.

