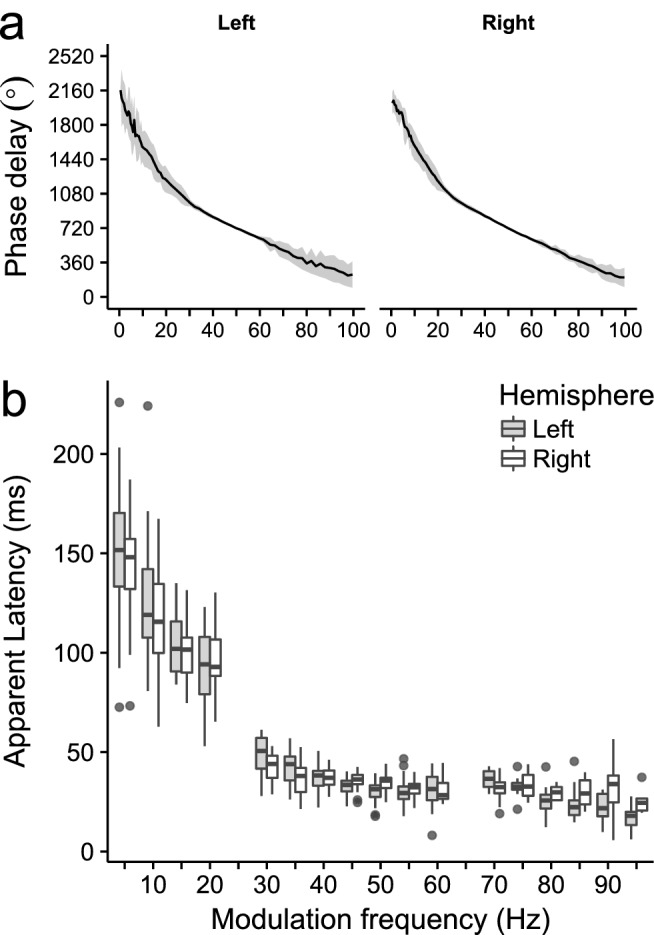
Figure 9.

Phase delay and apparent latency. (a) Group average phase delays ± one standard deviation as a function of modulation frequency for the left and right hemispheric channel . The phase delay at 50 Hz of each individual was set to 720° for illustrative purposes, note that this affects the presented standard deviations. (b) the apparent latencies as a function of modulation frequency. It is clear from (b) that with the increase of modulation frequency the predominate generators of the ASSR shift downwards in the ascending auditory pathway.
