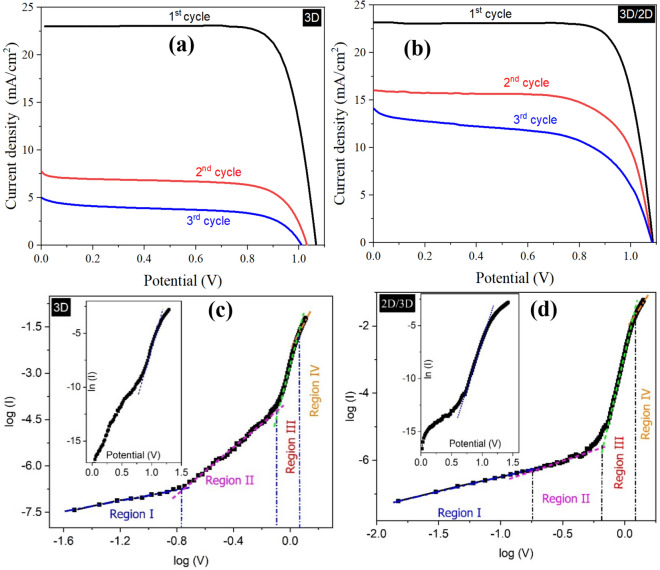
Figure 2.
(a,b) J–V curves of 3D and 2D/3D perovskite solar cells under 1 Sun illumination (100 mW/cm2), respectively. The J–V curves were recorded in three cycles at different intervals of time (fresh, 2500 h & 5000 h) to compare the change in the photovoltaic parameters of both 3D and 2D/3D samples. The J–V characteristics were recorded in the forward (from 0 to + V) direction at a scan rate of 25 mV/s. (c,d) represents the I–V curves of 3D and 2D/3D perovskite solar cells, respectively, under dark conditions.

