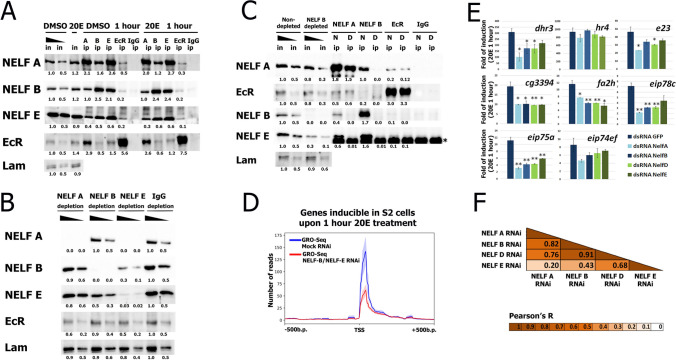
Figure 1.
NELF complex interacts with EcR receptor and affects transcription of 20E-dependent genes. (A) Immunoprecipitations (IPs) from nuclear protein extracts of 1-h 20E- and DMSO- treated Drosophila S2 cells. Immunoprecipitations were performed with antibodies against NELF-A, NELF-B, NELF-E and EcR (a serum of non-immunized rabbits (IgG ip) was used as a negative control), which is indicated on the top of the figure. Western blots were stained with the corresponding antibodies indicated on the left of the figure. Anti-lamin staining was used as loading control. All input and IP samples were loaded on a single western blot. Western blot stained with anti-NELF-E antibodies included additional titration line between the control and treated cells inputs, which was cut for the uniform presentation of the results. The DMSO-treated input was loaded in the serial loadings (1, 0.5) and used as the calibration for measuring the intensities of the IP lanes in a TotalLab program. The numbers below the IPs represent the portions of precipitated proteins relative to loaded DMSO-treated input. The full-size original Western blots are provided in Fig. S11. (B) Depletion of NELF subunits from the protein nuclear extract of uninduced Drosophila S2 cells. Depletions were performed with antibodies against NELF-A, NELF-B and NELF-E (a serum of non-immunized rabbits (IgG) was used as in a negative depletion control), which is indicated on the top of the figure. Western blots were stained with the corresponding antibodies indicated on the left of the figure. Anti-lamin staining was used as loading control. All input and depletion samples were loaded on a single western blot. All the depletions were loaded in the same serial loadings (1, 0.5). IgG depletion was used as the calibration for measuring the intensities of the rest of the depletions in a TotalLab program. The numbers below the depletions represent the portions of loaded proteins relative to loaded IgG depletion. The full-size original Western blots are provided in Fig. S12. (C) Immunoprecipitations (IPs) from nuclear protein extracts of uninduced Drosophila S2 cells, with NELF-B depletion (D—depleted) or without it (N—non-depleted). Immunoprecipitations were performed with antibodies against NELF-A, NELF-B, NELF-E and EcR (a serum of non-immunized rabbits (IgG ip) was used as a negative control), which is indicated on the top of the figure. Western blots were stained with the corresponding antibodies indicated on the left of the figure. Anti-lamin staining was used as loading control. All input and IP samples were loaded on a single western blot. The inputs were loaded in the serial loadings (1, 0.5) and the non-depleted input was used as the calibration for measuring the intensities of the NELF-B depleted input and IP lanes in a TotalLab program. The numbers below the NELF-B depleted input and IPs represent the portions of precipitated proteins relative to loaded non-depleted input. The full-size original Western blots are provided in Fig. S13. (D) The level of 5′proximal transcription at 20E-dependent promoters in Drosophila S2 cells concomitantly treated with dsRNAs against NELF-B and NELF-E or dsRNA to beta-galactosidase (as mock RNAi) was estimated by GRO-Seq (the GRO-Seq data were taken from GSM3274627 and GSM3274628 (described for the first time in ref.29) and the list of 20E-dependent genes from our previous study1). Pile-up profiles were calculated as a mean of a GRO-Seq signal. The Y-axis units represent number of reads. The standard error is displayed on the graphs as lighter area around the main line of the profile. (E) Transcriptional induction levels of 20E-dependent genes in 1-h 20E-induced Drosophila S2 cells relative to DMSO-treated. The impact of NELF-A, NELF-B, NELF-D and NELF-E subunits of NELF complex on 20E response was estimated using RNA interference-mediated knockdown with corresponding dsRNA (GFP dsRNA was taken as a mock RNAi). Transcriptional levels were assessed by qRT-PCR. The Y-axis units represent fold of transcription induction which was calculated as a ratio between transcriptional level of corresponding gene in a particular experiment and mock RNAi treated uninduced cells sample (and normalized on tubulin mRNA). The data are mean values from three independent experiments, error bars represent standard deviations. Asterisks indicate significance levels (Student’s t-test), **—p-value < 0.01, *—p-value < 0.05. Statistical analysis was performed relative to the transcriptional induction levels of the genes in GFP dsRNA treated S2 cells. (F) Pearson’s correlation matrix for the impact of NELF-A, NELF-B, NELF-D and NELF-E subunits knockdowns on transcriptional induction levels of 20E-dependent genes in 1-h 20E-induced Drosophila S2 cells relative to DMSO-treated (the list of the genes is the same as on E). The heat map reflects the indicated R values.

