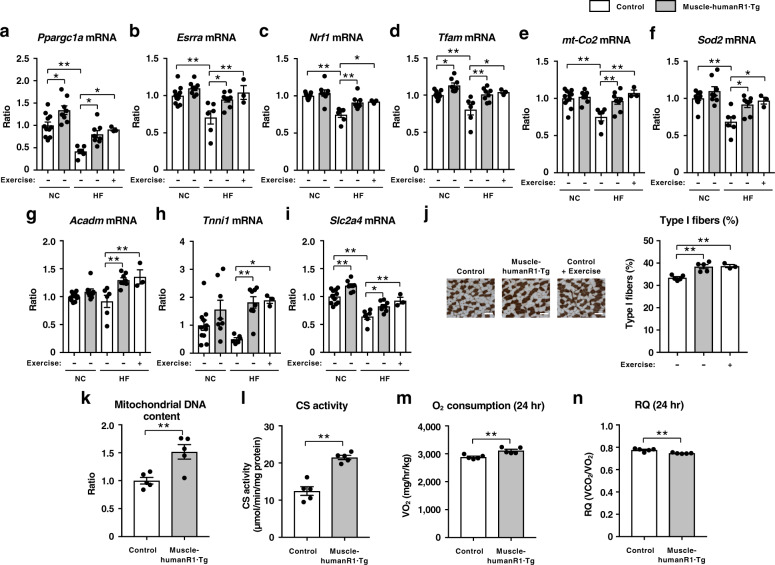
Fig. 3. Muscle-specific upregulation of human AdipoR1 increases genes involved in mitochondrial biogenesis and oxidative stress-detoxification on a normal chow or a high-fat diet.
Ppargc1a (a), Esrra (b), Nrf1 (c), Tfam (d), mt-Co2 (e), Sod2 (f), Acadm (g), Tnni1 (h) and Slc2a4 (i) mRNA levels in skeletal muscle from control and muscle-humanR1·Tg mice on a normal chow (NC) or a high-fat (HF) diet. Control mice on a NC diet (n = 11); muscle-humanR1·Tg mice on a NC diet (n = 8). Control mice on a HF diet (n = 6); muscle-humanR1·Tg mice on a HF diet (n = 8); control mice on a HF diet after 2 weeks exercise (n = 3). ATPase (pH 4.3 for type I fibers) staining of soleus muscle (j) (scale bars, 100 µM), quantification of type I fibers based on fiber-type analyses in soleus muscle from control and muscle-humanR1·Tg mice on a HF diet and control mice on a HF diet after 2 weeks exercise. Control mice on a HF diet (n = 5); muscle-humanR1·Tg mice on a HF diet (n = 5); control mice on a HF diet after 2 weeks exercise (n = 3). Mitochondrial DNA content (k) as assessed by mitochondrial DNA copy number and citrate synthase (CS) enzyme activity (l) in skeletal muscle from control and muscle-humanR1·Tg mice on a HF diet. Control mice on a HF diet (n = 5); muscle-humanR1·Tg mice on a HF diet (n = 5). Oxygen (O2) consumption (m) and respiratory quotient (RQ) (n) in control and muscle-humanR1·Tg mice on a HF diet. n = 5 each. All values are presented as means ± s.e.m. *P < 0.05 and **P < 0.01 compared to control mice or as indicated. P values were determined ANOVA followed by Tukey–Kramer multiple comparison tests (a–j) or unpaired two-tailed t-test (k–n). NS, not significant.

