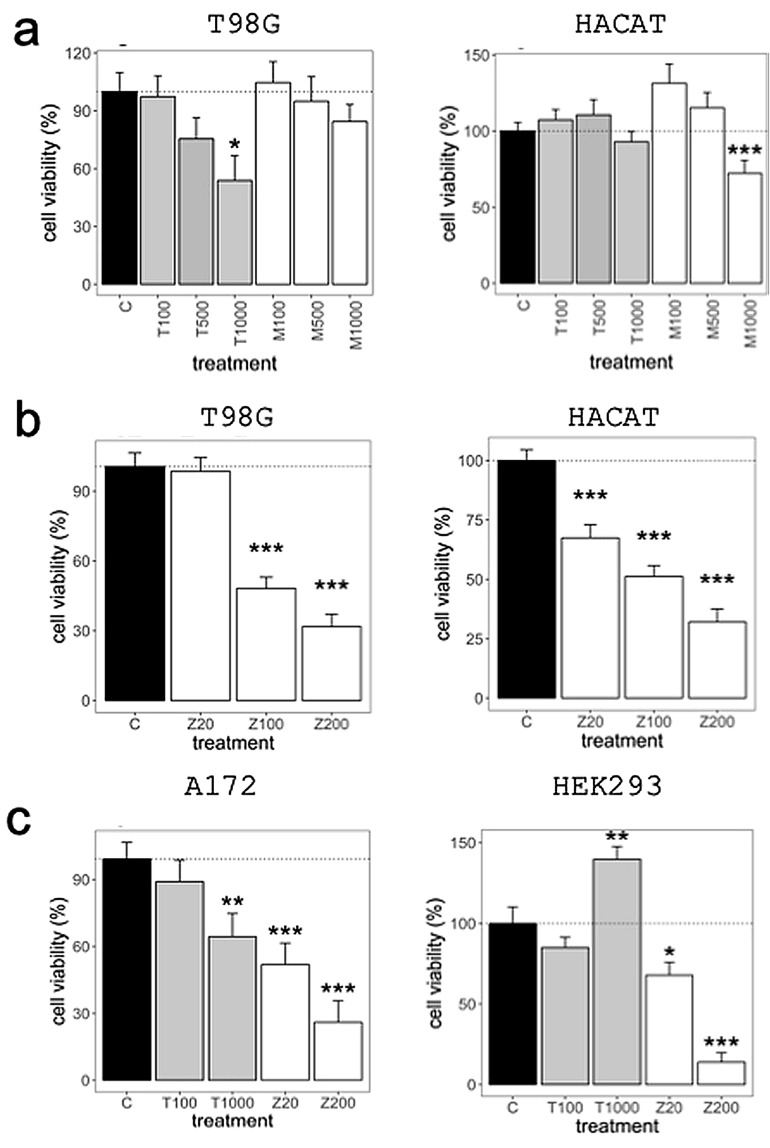
Figure 2.
Cell viability assay. (a) Cytotoxicity in T98G cell line (left) and HACAT non-cancerous cell line (right) following 72 h treatment with Tip and Middle extracts from the same DAV. (b) Dose-dependent representation for T98G (left) and HACAT (right) cell lines following 72 h treatment with TMZ. (c) Cytotoxicity in A172 (left) and HEK293 (right) cell lines following 72 h treatment with DAV extract and TMZ. Values are shown in μg/mL. T tip portion, M middle portion, Z TMZ. Linear mixed models to assess the effects of treatments were used. Data are means ± standard error of the mean (SEM) (n = 3). P-value of the significant pairwise comparison against control (+P = 0.1–0.05, *P = 0.05–0.01, **P = 0.01–0.001, ***P ≤ 0.001).

